Stock Market Outlook for November 9, 2023

Wholesale inventories remain on a contractionary path, a scenario that, in modern history, has only ever been seen during economic recessions.
*** Stocks highlighted are for information purposes only and should not be considered as advice to purchase or to sell mentioned securities. As always, the use of technical and fundamental analysis is encouraged in order to fine tune entry and exit points to average seasonal trends.
Stocks Entering Period of Seasonal Strength Today:
Subscribers Click on the relevant link to view the full profile. Not a subscriber? Signup here.

Invesco S&P MidCap Low Volatility ETF (AMEX:XMLV) Seasonal Chart

Deutsche X-trackers MSCI EAFE Hedged Equity ETF (NYSE:DBEF) Seasonal Chart

iShares Core S&P Total US Stock Market ETF (NYSE:ITOT) Seasonal Chart

Pacer Fund Trust Pacer Trendpilot US Large Cap ETF (AMEX:PTLC) Seasonal Chart

Global X SuperDividend ETF (AMEX:SDIV) Seasonal Chart

BMO Low Volatility US Equity ETF (TSE:ZLU.TO) Seasonal Chart

Badger Infrastructure Solutions Ltd. (TSE:BDGI.TO) Seasonal Chart
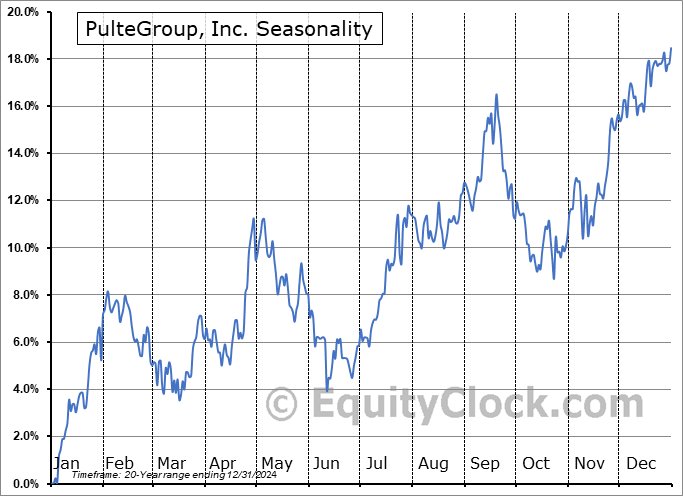
PulteGroup, Inc. (NYSE:PHM) Seasonal Chart

The J. M. Smucker Co. (NYSE:SJM) Seasonal Chart

Helen of Troy Ltd. (NASD:HELE) Seasonal Chart

Bruker Corp. (NASD:BRKR) Seasonal Chart

Algoma Central Corp. (TSE:ALC.TO) Seasonal Chart
The Markets
Stocks closed mixed for a second day as investors digest the gains from the week past. The S&P 500 Index ended higher by a mere tenth of one percent, starting to reveal near-term upside exhaustion around horizontal resistance at 4400. The horizontal hurdle aligns with the 100-day moving average, which has been curling lower in recent weeks. Momentum indicators remain pointed higher, but similar evidence of waning buying demand in the near-term can be picked out here as well. The benchmark has yet to emerge from the cloud of major moving averages that supported the upside move in prices between March and July, providing a rather questionable view of the sustainability of the upside trajectory from here. The major hurdle below to support the intermediate path of the benchmark heading into the best six months of the year trend for stocks is the range between 4100 and 4200, presenting the best risk-reward to accumulating equity exposure for the next seasonal uptick in prices that normally surrounds the US Thanksgiving holiday. In the interim, through the middle of November, tendencies for stocks tend to lean flat to negative following start of the month strength.

Today, in our Market Outlook to subscribers, we discuss the following:
- US Wholesale Sales and Inventories
- Seasonal trade in the Agriculture industry
- The depressed state of Agricultural commodities
- The negative path of Copper
Subscribers can look for this report in their inbox or by clicking on the following link and logging in: Market Outlook for November 9
Not signed up yet? Subscribe now to receive full access to all of the research and analysis that we publish.
Sentiment on Wednesday, as gauged by the put-call ratio, ended bearish at 1.20.

Seasonal charts of companies reporting earnings today:


S&P 500 Index


TSE Composite


| Sponsored By... |

|


