Stock Market Outlook for November 10, 2023

A number of sectors of the market are rolling over from resistance at 50-day moving averages.
*** Stocks highlighted are for information purposes only and should not be considered as advice to purchase or to sell mentioned securities. As always, the use of technical and fundamental analysis is encouraged in order to fine tune entry and exit points to average seasonal trends.
Stocks Entering Period of Seasonal Strength Today:
Subscribers Click on the relevant link to view the full profile. Not a subscriber? Signup here.
Vanguard Russell 1000 ETF (NASD:VONE) Seasonal Chart
Invesco Dynamic Building & Construction ETF (NYSE:PKB) Seasonal Chart
Maple Leaf Foods, Inc. (TSE:MFI.TO) Seasonal Chart
Medical Properties Trust Inc. (NYSE:MPW) Seasonal Chart
Andersons, Inc. (NASD:ANDE) Seasonal Chart
Spectrum Brands Inc. (NYSE:SPB) Seasonal Chart
Chimera Investment Corp. (NYSE:CIM) Seasonal Chart
Annaly Capital Management, Inc. (NYSE:NLY) Seasonal Chart
Unisys Corp. (NYSE:UIS) Seasonal Chart
GoDaddy Inc. (NYSE:GDDY) Seasonal Chart
Church & Dwight Co, Inc. (NYSE:CHD) Seasonal Chart
National Beverage Corp. (NASD:FIZZ) Seasonal Chart
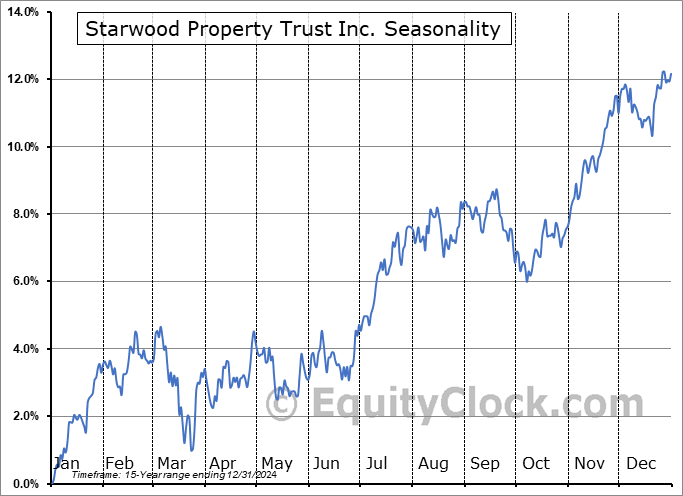
Starwood Property Trust Inc. (NYSE:STWD) Seasonal Chart
Taiwan Semiconductor Mfg (NYSE:TSM) Seasonal Chart
The Markets
Stocks closed lower on Thursday as investors continue to digest the gains that were recorded last week. The S&P 500 Index ended down by eight-tenths of one percent, turning lower from the 100-day moving average and horizontal resistance at 4400. The benchmark finds itself back at the 50-day moving average at 4340, a level that if re-broken could unleash another round of selling pressures to fill last week’s open gap around 4250. While these are all short-term hurdles to monitor, all that matters on an intermediate-term/seasonal basis is that the band of support between 4100 and 4200 holds. Seasonal tendencies for stocks through the middle of November are weak until the period surrounding the US Thanksgiving holiday, after which the positivity that accompanies the best six month of the year timeframe, as well as the year-end rally, returns.
Today, in our Market Outlook to subscribers, we discuss the following:
- Treasury bond prices back testing last week’s breakout point
- Sector ETFs being rejected from 50-day moving averages
- Active Investment managers ramping up their equity allocation again as buying exhaustion sets in
- Weekly Jobless Claims and the health of the labor market
Subscribers can look for this report in their inbox or by clicking on the following link and logging in: Market Outlook for November 10
Not signed up yet? Subscribe now to receive full access to all of the research and analysis that we publish.
Sentiment on Thursday, as gauged by the put-call ratio, ended bearish at 1.15.
Seasonal charts of companies reporting earnings today:
S&P 500 Index
TSE Composite
| Sponsored By... |

|


