Stock Market Outlook for November 13, 2023

The performance of growth over value has just entered into a new phase.
*** Stocks highlighted are for information purposes only and should not be considered as advice to purchase or to sell mentioned securities. As always, the use of technical and fundamental analysis is encouraged in order to fine tune entry and exit points to average seasonal trends.
Stocks Entering Period of Seasonal Strength Today:
Subscribers Click on the relevant link to view the full profile. Not a subscriber? Signup here.

iShares MSCI Mexico Capped ETF (NYSE:EWW) Seasonal Chart

Morgan Stanley India Investment Fund (NYSE:IIF) Seasonal Chart

iShares Latin America 40 ETF (NYSE:ILF) Seasonal Chart

SeaChange Intl, Inc. (NASD:SEAC) Seasonal Chart

Bunge Ltd. (NYSE:BG) Seasonal Chart

ABM Industries, Inc. (NYSE:ABM) Seasonal Chart

Terex Corp. (NYSE:TEX) Seasonal Chart

Jones Lang Lasalle, Inc. (NYSE:JLL) Seasonal Chart
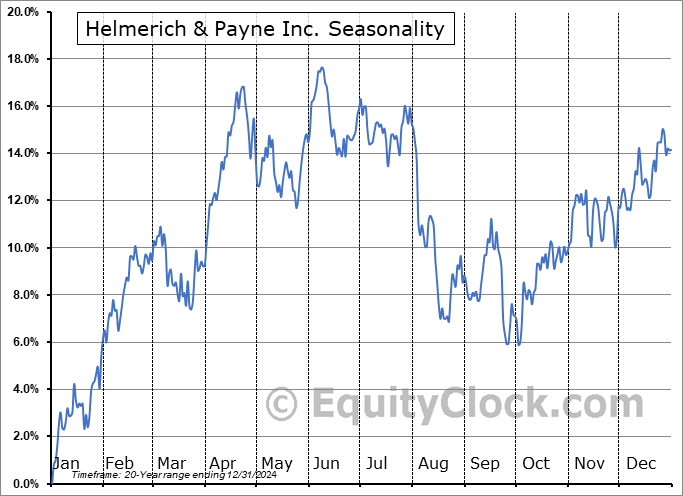
Helmerich & Payne Inc. (NYSE:HP) Seasonal Chart

Hologic, Inc. (NASD:HOLX) Seasonal Chart

Packaging Corp Of America (NYSE:PKG) Seasonal Chart

Wynn Resorts Ltd (NASD:WYNN) Seasonal Chart

CMS Energy Corp. (NYSE:CMS) Seasonal Chart

Invesco Municipal Trust (NYSE:VKQ) Seasonal Chart

iShares Global Timber & Forestry ETF (NASD:WOOD) Seasonal Chart

Invesco MSCI Sustainable Future ETF (NYSE:ERTH) Seasonal Chart

Federal Agricultural Mortgage (NYSE:AGM) Seasonal Chart

Sherritt Intl Corp. (TSE:S.TO) Seasonal Chart

Tidewater, Inc. (NYSE:TDW) Seasonal Chart

Northland Power Inc. (TSE:NPI.TO) Seasonal Chart

Plaza Retail REIT (TSE:PLZ/UN.TO) Seasonal Chart

Fluor Corp. (NYSE:FLR) Seasonal Chart

Photronics, Inc. (NASD:PLAB) Seasonal Chart
The Markets
Stocks rallied to close the week amidst a poor read of consumer sentiment that put investors back on recession watch, leading to stability in the cost of borrowing. The S&P 500 Index gained 1.56%, moving above the 4400 horizontal level of resistance that had capped upside momentum through much of the past week. The benchmark is starting to clear the cloud of major moving averages that spans between 4250 (the 200-day) and 4400 (the 100-day), attempting to put the weakness that played out through the average period of volatility for stocks during the third quarter in the rear-view mirror. Near-term momentum is still showing signs of waning and there is still reason to expect some digestion/weakness to play out in the week ahead before we get into the positivity that surrounds the US Thanksgiving holiday. Overall, there is nothing actionable on the intermediate-term scale to suggest flipping from our Accumulate rating that we have maintained of the large-cap benchmark for the past few weeks in our weekly chart books.

Today, in our Market Outlook to subscribers, we discuss the following:
- Weekly look at the large-cap benchmark
- The trend of forward earnings
- US Dollar, Yields, and Stocks
- Technology sector
- The new phase of outperformance for Growth
- Ned Davis Smart Sector ETF (SSUS)
Subscribers can look for this report in their inbox or by clicking on the following link and logging in: Market Outlook for November 13
Not signed up yet? Subscribe now to receive full access to all of the research and analysis that we publish.
Sentiment on Friday, as gauged by the put-call ratio, ended bearish at 1.07.

Seasonal charts of companies reporting earnings today:


S&P 500 Index


TSE Composite


| Sponsored By... |

|


