Stock Market Outlook for November 14, 2023

Core defensive sectors are reporting year-to-date declines and are vulnerable to tax-loss selling through the month ahead.
*** Stocks highlighted are for information purposes only and should not be considered as advice to purchase or to sell mentioned securities. As always, the use of technical and fundamental analysis is encouraged in order to fine tune entry and exit points to average seasonal trends.
Stocks Entering Period of Seasonal Strength Today:
Subscribers Click on the relevant link to view the full profile. Not a subscriber? Signup here.

Invesco Global Listed Private Equity ETF (NYSE:PSP) Seasonal Chart
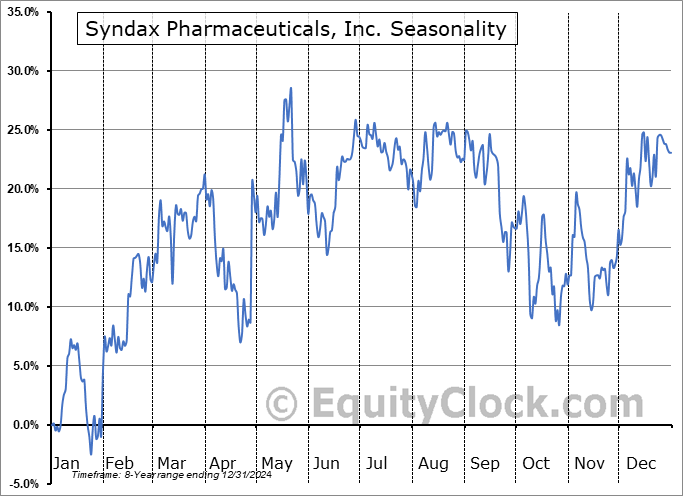
Syndax Pharmaceuticals, Inc. (NASD:SNDX) Seasonal Chart

Chartwell Retirement Residences (TSE:CSH/UN.TO) Seasonal Chart

Granite Real Estate Investment Trust (TSE:GRT/UN.TO) Seasonal Chart

Esco Technologies, Inc. (NYSE:ESE) Seasonal Chart
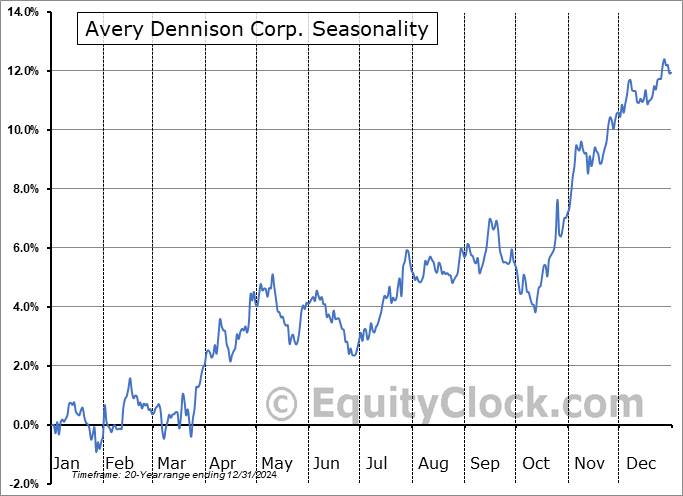
Avery Dennison Corp. (NYSE:AVY) Seasonal Chart

Rocky Mountain Chocolate Factory, Inc. (NASD:RMCF) Seasonal Chart
The Markets
Stocks closed generally mixed on Monday as the buying momentum that started the month continues to slow. The S&P 500 Index closed a mere 3 points in negative territory, holding levels above recently broken resistance, now implied support, around the 50-day moving average. Momentum indicators remain pointed higher, but a notable lack of expansion in the MACD histogram expresses the waning enthusiasm of investors to chase at the present time, something that is rather typical through the middle of November. Following the uptick of equity prices during the first week of November, coinciding with the start of the best six months of the year for the market, prices tend to trade flat to negative through the middle of the month before taking off again to the upside around the US Thanksgiving week. This next positive seasonal timeframe is ahead and, in the interim, more of this grind/digestion of early month strength is to be expected. What would be constructive for the normal end-of-year rally for stocks is for the large-cap benchmark to retrace back into and confirm support within the cloud of major moving averages that the benchmark has attempted to escape from in recent days. During bull market trends, the cloud of major moving averages provides support to the price action, while bear market trends use the equivalent hurdles as points of resistance. The cloud has been starting to show very early signs of rolling over in recent weeks, therefore we want to see these hurdles reinvigorate themselves to the upside to confirm sustainability to the strength that has been observed since the end of October. Horizontal support in the range of 4100 and 4200 remains the proverbial line in the sand and as long as the benchmark remains above this hurdle heading into the end of the year, it is more appropriate the err on the side of an upside bias for stocks rather than bet on a downside outcome akin to a recessionary decline in prices.

Today, in our Market Outlook to subscribers, we discuss the following:
- Medical Device ETF (IHI)
- Aerospace & Defense ETF (ITA)
- Oil Services ETF (OIH)
- Our weekly Chart Books update and our list of all segments of the market to either Accumulate or Avoid
- Copper
- Utilities and REITs showing resistance below their 200-week moving averages
Subscribers can look for this report in their inbox or by clicking on the following link and logging in: Market Outlook for November 14
Not signed up yet? Subscribe now to receive full access to all of the research and analysis that we publish.
Want to know which areas of the market to buy or sell? Our Weekly Chart Books have just been updated, providing a clear Accumulate, Avoid, or Neutral rating for currencies, cryptocurrencies, commodities, broad markets, and subsectors/industries of the market. Subscribers can login and click on the relevant links to access.
- Currencies
- Cryptocurrencies
- Commodities
- Major Benchmarks
- Sub-sectors / Industries
- ETFs: Bonds | Commodities | Equity Markets | Industries | Sectors
Subscribe now.
Sentiment on Monday, as gauged by the put-call ratio, ended bearish at 1.17.

Seasonal charts of companies reporting earnings today:
 Seasonal Chart")


S&P 500 Index


TSE Composite


| Sponsored By... |

|


