Stock Market Outlook for November 17, 2023

While stocks look exhausted in the short-term, an upside bias is normal through the week of US Thanksgiving.
*** Stocks highlighted are for information purposes only and should not be considered as advice to purchase or to sell mentioned securities. As always, the use of technical and fundamental analysis is encouraged in order to fine tune entry and exit points to average seasonal trends.
Stocks Entering Period of Seasonal Strength Today:
Subscribers Click on the relevant link to view the full profile. Not a subscriber? Signup here.
Xenon Pharmaceuticals Inc. (NASD:XENE) Seasonal Chart
iShares Emerging Markets Local Currency Bond ETF (AMEX:LEMB) Seasonal Chart
iShares MSCI Global Agriculture Producers ETF (AMEX:VEGI) Seasonal Chart
Tree Island Steel Ltd. (TSE:TSL.TO) Seasonal Chart
Asbury Automotive Group Inc. (NYSE:ABG) Seasonal Chart
Darling Ingredients Inc. (NYSE:DAR) Seasonal Chart
Taseko Mines Ltd. (TSE:TKO.TO) Seasonal Chart
Clough Global Dividend and Income Fund (AMEX:GLV) Seasonal Chart
iShares Russell Mid-Cap Value ETF (NYSE:IWS) Seasonal Chart
Banco Santander SA (NYSE:SAN) Seasonal Chart
CGI Group, Inc. (TSE:GIB/A.TO) Seasonal Chart
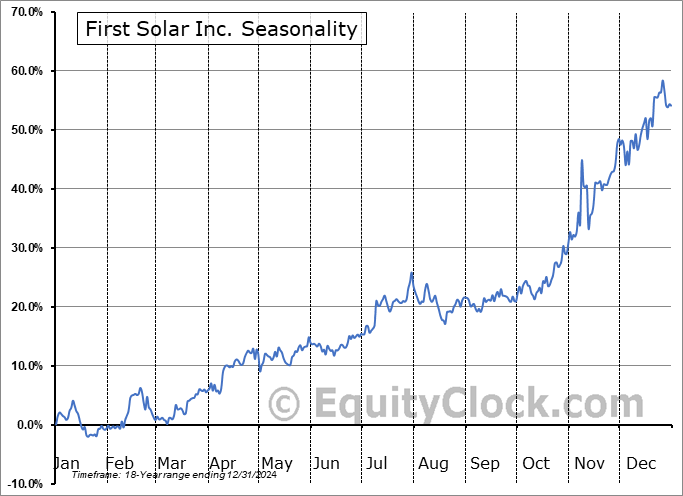
First Solar Inc. (NASD:FSLR) Seasonal Chart
Daktronics, Inc. (NASD:DAKT) Seasonal Chart
Quanex Corp. (NYSE:NX) Seasonal Chart
Smith and Nephew PLC (NYSE:SNN) Seasonal Chart
Barrick Gold Corp. (TSE:ABX.TO) Seasonal Chart
Heroux, Inc. (TSE:HRX.TO) Seasonal Chart
RE/Max Holdings Inc. (NYSE:RMAX) Seasonal Chart
The Markets
Stocks closed mixed on Thursday as questions pertaining to the health of the economy had investors selling down consumer stocks, both staples and discretionary. The S&P 500 Index closed with a gain of just over a tenth of one percent, continuing to show a slight stall around psychological resistance of 4500 as traders scrutinize how far price has come since the end of October. Levels of support below the benchmark remain plentiful, including open gaps and major moving averages, while levels of resistance are becoming fewer the higher the benchmark climbs. This is an attribute of a bullish trend and, although some digestion appears logical before the next advance materializes coinciding with the normal end-of year strength, holding a positive bias towards equity allocations in portfolios remains warranted. The Relative Strength Index (RSI) continues to knock on the door of overbought territory around 70 and the MACD histogram is showing signs of upside exhaustion, both conducive to realize a retracement lower in prices over the near-term.
Today, in our Market Outlook to subscribers, we discuss the following:
- Stock market tendency around the US Thanksgiving holiday
- US Industrial Production
- The impact of weak industrial production on deciding who the next US President will be
- Manufacturer sentiment
- On the lookout for a low in the price of Oil and where/when that may be
Subscribers can look for this report in their inbox or by clicking on the following link and logging in: Market Outlook for November 17
Not signed up yet? Subscribe now to receive full access to all of the research and analysis that we publish.
Sentiment on Thursday, as gauged by the put-call ratio, ended close to neutral at 0.94.
Seasonal charts of companies reporting earnings today:
S&P 500 Index
TSE Composite
| Sponsored By... |

|


