Stock Market Outlook for November 27, 2023

One indicator is suggesting that the market is bordering on complacency heading into the normal tax-loss selling period early in December.
*** Stocks highlighted are for information purposes only and should not be considered as advice to purchase or to sell mentioned securities. As always, the use of technical and fundamental analysis is encouraged in order to fine tune entry and exit points to average seasonal trends.
Stocks Entering Period of Seasonal Strength Today:
Subscribers Click on the relevant link to view the full profile. Not a subscriber? Signup here.
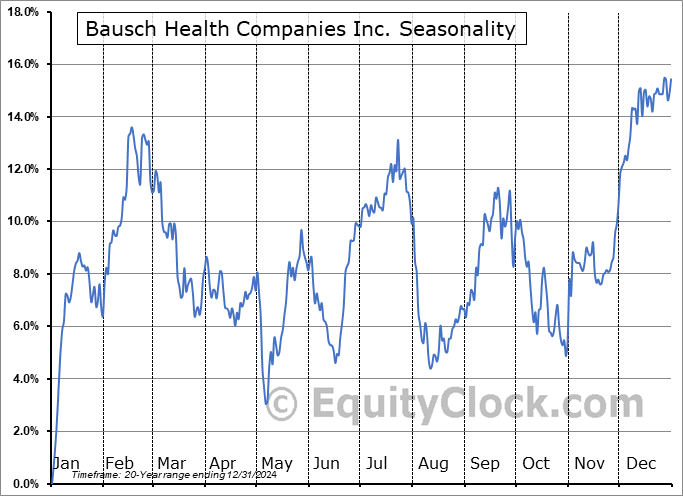
Bausch Health Companies Inc. (TSE:BHC.TO) Seasonal Chart

Federated Hermes, Inc. (NYSE:FHI) Seasonal Chart

iShares U.S. Medical Devices ETF (NYSE:IHI) Seasonal Chart

Marathon Gold Corp. (TSE:MOZ.TO) Seasonal Chart

Tenet Healthcare Corp. (NYSE:THC) Seasonal Chart

iShares MSCI Turkey ETF (NASD:TUR) Seasonal Chart

Aberdeen Standard Physical Palladium Shares ETF (NYSE:PALL) Seasonal Chart

Aberdeen Emerging Markets Equity Income Fund, Inc. (AMEX:AEF) Seasonal Chart

Novagold Resources, Inc. (TSE:NG.TO) Seasonal Chart

Martinrea Intl Inc. (TSE:MRE.TO) Seasonal Chart

Global X Uranium ETF (NYSE:URA) Seasonal Chart

Trican Well Service Ltd. (TSE:TCW.TO) Seasonal Chart

VanEck Vectors Steel ETF (NYSE:SLX) Seasonal Chart

NexGen Energy Ltd. (NYSE:NXE) Seasonal Chart
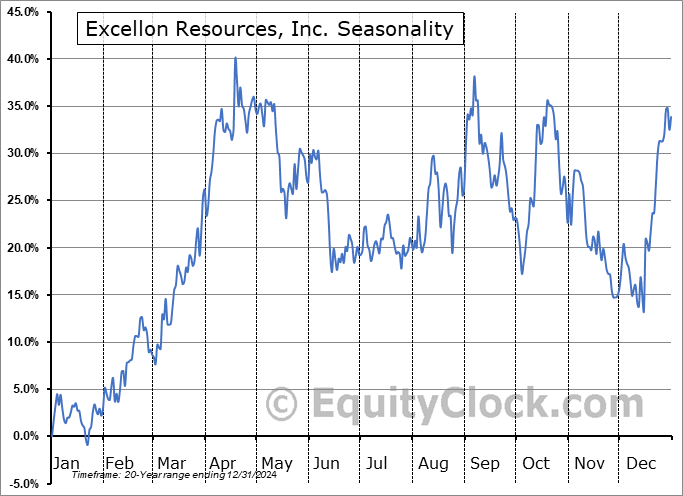
Excellon Resources, Inc. (TSE:EXN.TO) Seasonal Chart
The Markets
Stocks were little changed in the shortened post Thanksgiving day session as traders took a break to enjoy the holiday. The S&P 500 Index closed with a gain of a mere six basis points (0.06%), holding around multi-month highs as the market looks towards the tax-loss selling period that is normal in the first half of December. The benchmark remains in overbought territory according to the Relative Strength Index (RSI) and the MACD histogram continues to narrow, suggesting near-term exhaustion and lending to the likelihood that the market will realize a pause/re-tracement in the near-term coinciding with the year-end portfolio reallocation tendency. The intermediate seasonal pattern remains positive, benefiting from the Santa Claus Rally period that plays out in the back half of December, but a near-term digestion is certainly reasonable and probable. Levels of support below the benchmark remain numerous, including gap support (4450, 4325, and 4250) and major moving averages. On the extreme side, the 50-day moving average at 4344 is logical near-term retracement point, but it is likely that, barring some shock fundamental event, levels around gap support in the range of 4400 to 4450 will be the propping point to the end-of-year rally that tends to carry stock prices higher into the start of the new year.

Today, in our Market Outlook to subscribers, we discuss the following:
- Weekly look at the large-cap benchmark
- Core-defensive sectors vulnerable into the tax-loss selling period
- Market bordering on complacency
- The distorted weekly jobless claims figures for last week
- Canadian Retail Sales and what they have to say about the consumer/economy
Subscribers can look for this report in their inbox or by clicking on the following link and logging in: Market Outlook for November 27
Not signed up yet? Subscribe now to receive full access to all of the research and analysis that we publish.
Sentiment on Friday, as gauged by the put-call ratio, ended bearish at 1.12.

Seasonal charts of companies reporting earnings today:


S&P 500 Index


TSE Composite


| Sponsored By... |

|


