Stock Market Outlook for December 6, 2023

With varying dynamics playing out at the end of the year, it can often be beneficial to just be broad in portfolio exposure rather than target particular segments.
*** Stocks highlighted are for information purposes only and should not be considered as advice to purchase or to sell mentioned securities. As always, the use of technical and fundamental analysis is encouraged in order to fine tune entry and exit points to average seasonal trends.
Stocks Entering Period of Seasonal Strength Today:
Subscribers Click on the relevant link to view the full profile. Not a subscriber? Signup here.

Invesco Fundamental High Yield Corporate Bond ETF (NYSE:PHB) Seasonal Chart

Skeena Resources Limited (TSE:SKE.TO) Seasonal Chart

Acme United Corp. (AMEX:ACU) Seasonal Chart

VanEck Vectors Uranium+Nuclear Energy ETF (NYSE:NLR) Seasonal Chart

Paramount Global (NASD:PARA) Seasonal Chart

VanEck Vectors Israel ETF (AMEX:ISRA) Seasonal Chart

Tech Leaders Income ETF (TSE:TLF.TO) Seasonal Chart
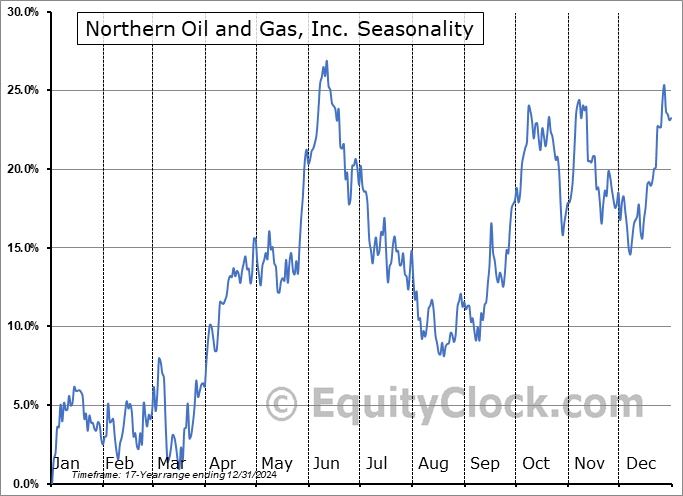
Northern Oil and Gas, Inc. (NYSE:NOG) Seasonal Chart

Huntsman Corp. (NYSE:HUN) Seasonal Chart

Smart Real Estate Investment Trust (TSE:SRU/UN.TO) Seasonal Chart

Lundin Gold Inc. (TSE:LUG.TO) Seasonal Chart

Ensign Energy Services, Inc. (TSE:ESI.TO) Seasonal Chart

iShares MSCI Switzerland Capped ETF (NYSE:EWL) Seasonal Chart

BCE, Inc. (TSE:BCE.TO) Seasonal Chart

iShares S&P/TSX Canadian Dividend Aristocrats Index ETF (TSE:CDZ.TO) Seasonal Chart

Pan American Silver Corp. (NASD:PAAS) Seasonal Chart
The Markets
Stocks slipped on Tuesday as yesterday’s gainers become today’s losers in typical rotational fashion for this time of year. The S&P 500 Index shed a mere six basis points (0.06%), charting yet another doji indecision candlestick around the 4550 level, something that has become a theme over the past eight trading sessions. The benchmark sits just below the July high and significant resistance at 4600, a level that provides the logical level to trigger the normal retracement lower in stocks coinciding with the tax-loss selling period that runs through the first half of December. Momentum indicators continue to roll over with MACD on the verge of triggering a sell signal given the encroachment on its signal line. The intermediate-term path continues to be viewed in a positive bias, leaving us with little to do from an overall seasonal portfolio allocation perspective given that we are fully invested, but traders should be aware that a pullback in the near-term is normal and should be expected. Levels of support below are plentiful, including major moving averages and upside open gaps; the November 14th upside gap around 4450 is the logical near-term target, a level that, if tested, would provide the ideal setup to the Santa Claus rally period that runs through the back half of the month and into the new year.

Today, in our Market Outlook to subscribers, we discuss the following:
- The highly rotational market
- Weakness in core-cyclical sectors and the gap lower in Materials
- Opportunity cost to holding bonds over stocks has been nil
- Job Openings and Labor Turnover Survey (JOLTS)
- US Factory Orders
Subscribers can look for this report in their inbox or by clicking on the following link and logging in: Market Outlook for December 6
Not signed up yet? Subscribe now to receive full access to all of the research and analysis that we publish.
Sentiment on Tuesday, as gauged by the put-call ratio, ended slightly bullish at 0.91.

Seasonal charts of companies reporting earnings today:


S&P 500 Index


TSE Composite


| Sponsored By... |

|

