Stock Market Market Outlook for December 11, 2023

While election year cycle tendencies suggest strength for stocks into year-end, weakness through the first ten weeks of an election year is normal.
*** Stocks highlighted are for information purposes only and should not be considered as advice to purchase or to sell mentioned securities. As always, the use of technical and fundamental analysis is encouraged in order to fine tune entry and exit points to average seasonal trends.
Stocks Entering Period of Seasonal Strength Today:
Subscribers Click on the relevant link to view the full profile. Not a subscriber? Signup here.

BMO S&P/TSX Capped Composite Index ETF (TSE:ZCN.TO) Seasonal Chart

Morgan Stanley Emerging Markets Domestic Debt Fund (NYSE:EDD) Seasonal Chart

iShares Europe ETF (NYSE:IEV) Seasonal Chart

Aberdeen Standard Physical Platinum Shares ETF (NYSE:PPLT) Seasonal Chart
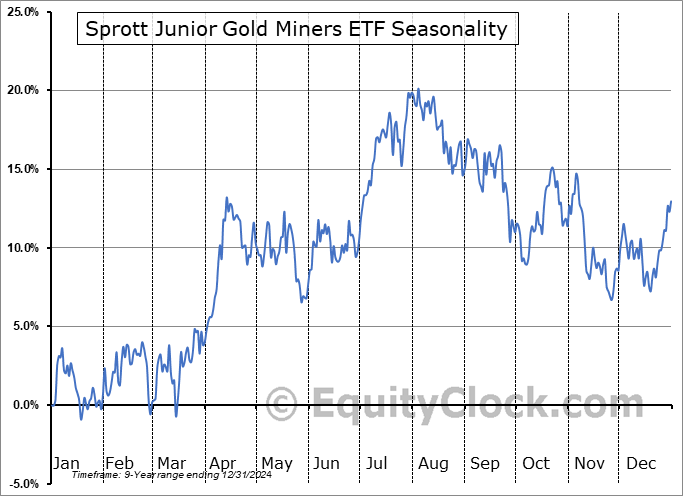
Sprott Junior Gold Miners ETF (AMEX:SGDJ) Seasonal Chart

SPDR S&P Health Care Equipment ETF (NYSE:XHE) Seasonal Chart

Major Drilling Group Intl, Inc. (TSE:MDI.TO) Seasonal Chart

Denison Mines Corp. (TSE:DML.TO) Seasonal Chart
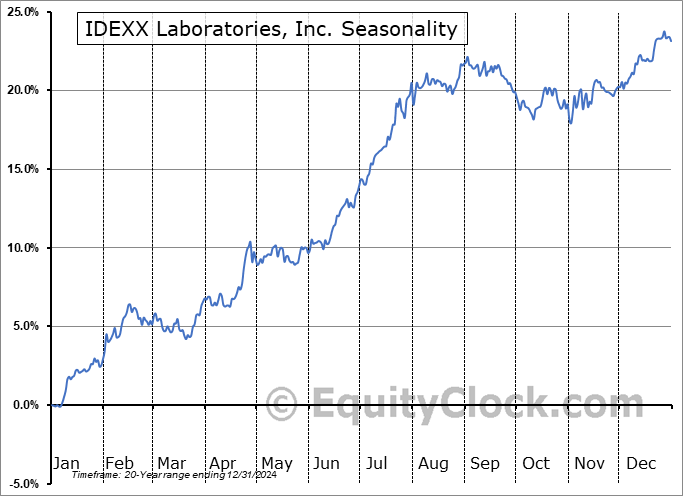
IDEXX Laboratories, Inc. (NASD:IDXX) Seasonal Chart

iShares S&P/TSX Capped REIT Index ETF (TSE:XRE.TO) Seasonal Chart

Constellation Software Inc. (TSE:CSU.TO) Seasonal Chart

Extendicare Inc. (TSE:EXE.TO) Seasonal Chart

Premium Brands Holdings Corp. (TSE:PBH.TO) Seasonal Chart

CAE, Inc. (TSE:CAE.TO) Seasonal Chart
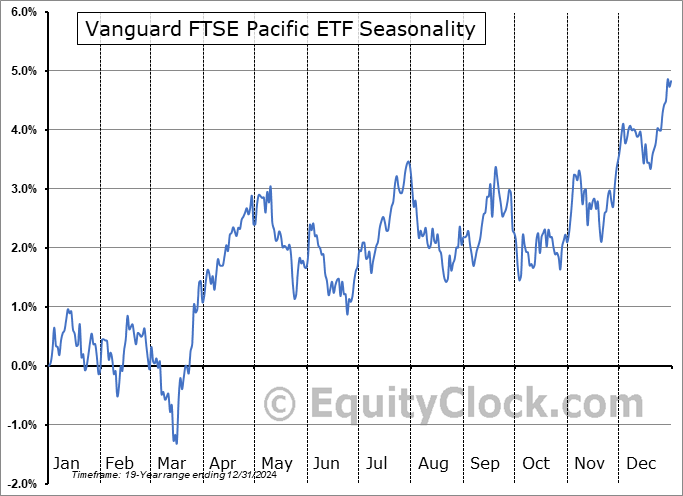
Vanguard FTSE Pacific ETF (NYSE:VPL) Seasonal Chart

iShares Canadian Value Index ETF (TSE:XCV.TO) Seasonal Chart

Sony Group Corporation (NYSE:SONY) Seasonal Chart

Ambev SA (NYSE:ABEV) Seasonal Chart

Endeavour Mining Corp. (TSE:EDV.TO) Seasonal Chart

BMO S&P/TSX Equal Weight Oil & Gas Index ETF (TSE:ZEO.TO) Seasonal Chart

Canadian Utilities Ltd. (TSE:CU.TO) Seasonal Chart

SPDR S&P Global Dividend ETF (AMEX:WDIV) Seasonal Chart

Vanguard Total International Stock ETF (NASD:VXUS) Seasonal Chart

AirBoss of America Corp. (TSE:BOS.TO) Seasonal Chart

Bonterra Energy Corp. (TSE:BNE.TO) Seasonal Chart

Toronto-Dominion Bank (TSE:TD.TO) Seasonal Chart

iShares Convertible Bond ETF (AMEX:ICVT) Seasonal Chart

iShares MSCI Emerging Markets Small-Cap ETF (AMEX:EEMS) Seasonal Chart
The Markets
Stocks pushed higher on Friday following the release of a stronger than expected report of employment in the US that calmed investor fears that the labor market is slowing. The S&P 500 Index closed with a gain of four-tenths of one percent, pressuring resistance at the July high of 4600. Despite momentum indicators triggering sell signals in recent days and the fact that we are well within the traditional tax-loss selling period that spans the first half of December, there is not much of a pullback to speak of, other than a sideways digestive pattern. Hints of a FOMO (“Fear of Missing Out”) trade is emerging with the VIX falling to the lowest level since the days prior to the pandemic, risking the production of a complacent market heading into the Santa Claus rally period, adding an element of vulnerability to prices through the positive period for equity prices at year-end. Levels of support below the benchmark remain plentiful and the mid-November upside open gap around 4450 remains the logical retracement zone should the broad market start to portray the weakness that is normal for the first half of December.

Today, in our Market Outlook to subscribers, we discuss the following:
- Weekly look at the large-cap benchmark
- Election Year tendencies for stocks
- US Employment Situation and the areas of the labor market that are thriving
- The weakest November increase to Retail employment since 2008
Subscribers can look for this report in their inbox or by clicking on the following link and logging in: Market Outlook for December 11
Not signed up yet? Subscribe now to receive full access to all of the research and analysis that we publish.
Sentiment on Friday, as gauged by the put-ca; ratio, ended bullish at 0.89.

Seasonal charts of companies reporting earnings today:


S&P 500 Index


TSE Composite


| Sponsored By... |

|


