Stock Market Outlook for December 14, 2023

Bond prices continue to have upside potential into and through the start of the new year.
*** Stocks highlighted are for information purposes only and should not be considered as advice to purchase or to sell mentioned securities. As always, the use of technical and fundamental analysis is encouraged in order to fine tune entry and exit points to average seasonal trends.
Stocks Entering Period of Seasonal Strength Today:
Subscribers Click on the relevant link to view the full profile. Not a subscriber? Signup here.

Covenant Logistics Group, Inc (NASD:CVLG) Seasonal Chart

Beam Global (NASD:BEEM) Seasonal Chart

Vanguard Mid-Cap ETF (NYSE:VO) Seasonal Chart
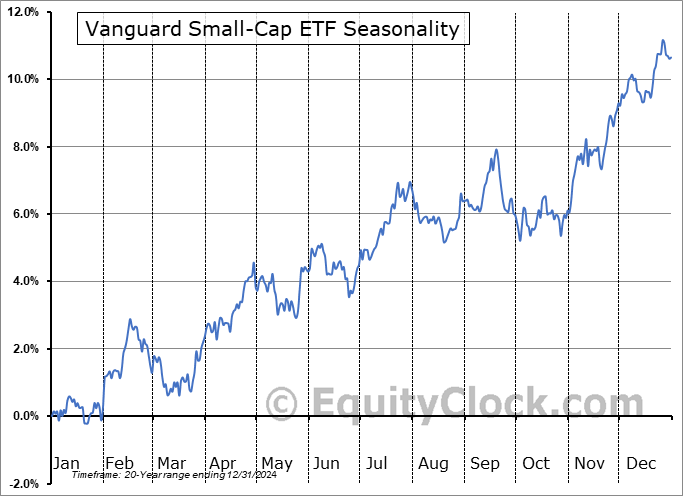
Vanguard Small-Cap ETF (NYSE:VB) Seasonal Chart

Oppenheimer Small Cap Revenue ETF (AMEX:RWJ) Seasonal Chart

Invesco Dynamic Oil & Gas Services ETF (NYSE:PXJ) Seasonal Chart

iShares Russell Mid-Cap ETF (NYSE:IWR) Seasonal Chart

iShares U.S. Oil & Gas Exploration & Production ETF (NYSE:IEO) Seasonal Chart

BMO S&P/TSX Equal Weight Global Base Metals Hedged to CAD Index ETF (TSE:ZMT.TO) Seasonal Chart

InPlay Oil Corp. (TSE:IPO.TO) Seasonal Chart

Eagle Bulk Shipping Inc. (NASD:EGLE) Seasonal Chart
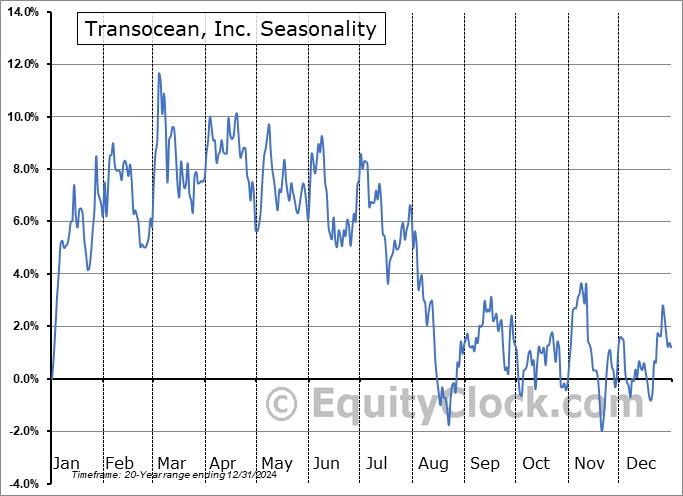
Transocean, Inc. (NYSE:RIG) Seasonal Chart

Touchstone Exploration, Inc. (TSE:TXP.TO) Seasonal Chart

LyondellBasell Industries NV (NYSE:LYB) Seasonal Chart

Enphase Energy Inc. (NASD:ENPH) Seasonal Chart

Schlumberger Ltd. (NYSE:SLB) Seasonal Chart

Eastern Co. (NASD:EML) Seasonal Chart

Platinum Group Metals Ltd. (AMEX:PLG) Seasonal Chart
The Markets
Stocks rallied on Wednesday as investors embraced the news that the Fed may seek to cut rates multiple times in the next year now that the trend of inflation has slowed. The S&P 500 Index jumped by 1.37%, leaving behind the 4600 level of horizontal resistance that had capped the benchmark this summer and putting the market’s sights on the all-time high around 4800. The benchmark is now less than 100-points away from getting back to its record height and there will undoubtedly be a pull into this zone given the fact that this hurdle seemed unattainable following the third quarter pullback in stocks. Wednesday’s gain elevates the Relative Strength Index (RSI) further into overbought territory to now sit at the highest level since September of 2020, just prior to a swift 10% correction in price that played out over a three-week period that followed. While near-term risks of a pullback remain elevated, it would be difficult to achieve any type of significant negative move around the last couple of weeks of the year when a chase for equity performance, a general upbeat bias among investors, and a portfolio rebalance trade tends to lift all boats. We have to contemplate that the strength that has been realized through the traditional tax-loss selling period may have pulled forward this notorious end-0f-year positivity, but we don’t have much reason to suggest that the market cannot continue to make incremental progress to the upside into the new year before we can stick a pin in this rally as market participants become even more complacent through the weeks ahead.

Today, in our Market Outlook to subscribers, we discuss the following:
- Major treasury bond ETFs moving back above their 200-day moving averages
- Aggregate bonds
- The logical retracement target for the 10-year Treasury Note Yield
- Election year tendencies for yields
- US Petroleum Status, including the state of supply and demand
- US Producer Price Index (PPI)
Subscribers can look for this report in their inbox or by clicking on the following link and logging in: Market Outlook for December 14
Not signed up yet? Subscribe now to receive full access to all of the research and analysis that we publish.
Sentiment on Wednesday, as gauged by the put-call ratio, ended slightly bearish at 1.02.

Seasonal charts of companies reporting earnings today:


S&P 500 Index


TSE Composite


| Sponsored By... |

|

