Stock Market Outlook for December 18, 2023

While stock prices have surpassed their July highs, active investment managers are expressing skepticism.
*** Stocks highlighted are for information purposes only and should not be considered as advice to purchase or to sell mentioned securities. As always, the use of technical and fundamental analysis is encouraged in order to fine tune entry and exit points to average seasonal trends.
Stocks Entering Period of Seasonal Strength Today:
Subscribers Click on the relevant link to view the full profile. Not a subscriber? Signup here.

PIMCO High Income Fund (NYSE:PHK) Seasonal Chart
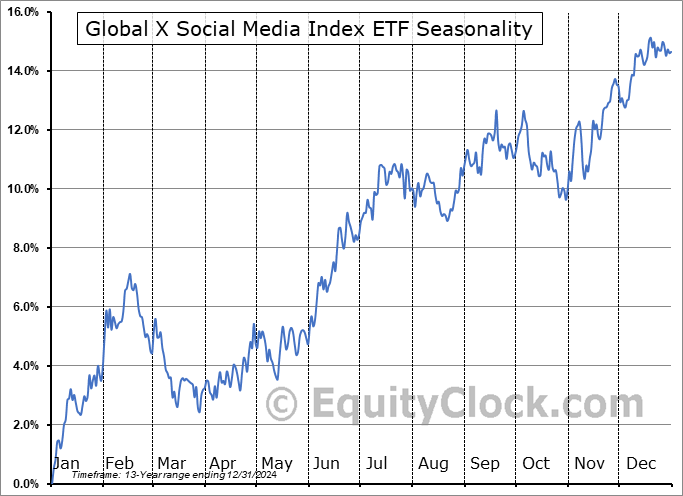
Global X Social Media Index ETF (NASD:SOCL) Seasonal Chart

Vanguard S&P Mid-Cap 400 Growth ETF (NYSE:IVOG) Seasonal Chart

Madison Square Garden Co. (NYSE:MSGS) Seasonal Chart

Ballard Power Systems, Inc. (NASD:BLDP) Seasonal Chart

Universal Display Corp. (NASD:OLED) Seasonal Chart

Cheniere Energy, Inc. (AMEX:LNG) Seasonal Chart

Lithium Americas Corp. (TSE:LAC.TO) Seasonal Chart

Lennox Intl Inc. (NYSE:LII) Seasonal Chart

Royal Bank of Canada (TSE:RY.TO) Seasonal Chart

Vanguard FTSE Canadian Capped REIT Index ETF (TSE:VRE.TO) Seasonal Chart

Western Copper Corp. (TSE:WRN.TO) Seasonal Chart

BHP Group Limited (NYSE:BHP) Seasonal Chart

Texas Instruments, Inc. (NASD:TXN) Seasonal Chart

New Flyer Industries Inc. (TSE:NFI.TO) Seasonal Chart

SPDR Dow Jones International Real Estate ETF (NYSE:RWX) Seasonal Chart

Invesco DWA Energy Momentum ETF (NASD:PXI) Seasonal Chart

Birchcliff Energy Limited (TSE:BIR.TO) Seasonal Chart

Magellan Aerospace Corp. (TSE:MAL.TO) Seasonal Chart

North American Construction Group Ltd (TSE:NOA.TO) Seasonal Chart
The Markets
Stocks closed on either side of the flat-line on Friday as traders start to take a breather following an active week in the market. The S&P 500 Index closed down by a mere basis point (0.01%), charting a second consecutive doji candlestick as investors look for the next catalyst to move the market. The benchmark remains the most overbought according to the Relative Strength Index (RSI) since September of 2020, giving investors caution in committing new funds at these heights. The benchmark finds itself between the previous 52-week high at 4600 and the all-time high at 4800. While there are near-term risks of a retest of previous resistance as support, the base case at present is that the draw of the market back to the previous peak will occur as part of the end of year rally that traditionally gets underway in the weeks surrounding the end of year-holidays. With much of the Santa Claus rally performance likely pulled forward, we may see a slower start out of the gate of this normally upbeat time of year that runs through the back half of December, but the chase for performance is likely to be on before portfolio managers will be required to close the books on their portfolios for the year.

Today, in our Market Outlook to subscribers, we discuss the following:
- Weekly look at the large-cap benchmark
- Equal Weight S&P 500 Index and the expansion of market breadth
- Active Investment Manager allocation to stocks
- The Yield Curve
- US Industrial Production
- How the Industrial economy typically performs during election years
- Manufacturer sentiment
Subscribers can look for this report in their inbox or by clicking on the following link and logging in: Market Outlook for December 18
Not signed up yet? Subscribe now to receive full access to all of the research and analysis that we publish.
Sentiment on Friday, as gauged by the put-call ratio, ended bullish at 0.79.

Seasonal charts of companies reporting earnings today:


S&P 500 Index


TSE Composite


| Sponsored By... |

|

