Stock Market Outlook for December 22, 2023

Should Santa Claus fail to deliver during the end of year rally period, equity market performance tends to be weak through the start of the new year.
*** Stocks highlighted are for information purposes only and should not be considered as advice to purchase or to sell mentioned securities. As always, the use of technical and fundamental analysis is encouraged in order to fine tune entry and exit points to average seasonal trends.
Stocks Entering Period of Seasonal Strength Today:
Subscribers Click on the relevant link to view the full profile. Not a subscriber? Signup here.

BMO Junior Gold Index ETF (TSE:ZJG.TO) Seasonal Chart

Optical Cable Corp. (NASD:OCC) Seasonal Chart

Sprott Physical Gold Trust (NYSE:PHYS) Seasonal Chart

iShares International Select Dividend ETF (NYSE:IDV) Seasonal Chart

iShares MSCI Canada ETF (NYSE:EWC) Seasonal Chart

Global X NASDAQ China Technology ETF (AMEX:CHIC) Seasonal Chart

iShares Canadian Short Term Bond Index ETF (TSE:XSB.TO) Seasonal Chart

iShares Canadian Universe Bond Index ETF (TSE:XBB.TO) Seasonal Chart

iShares S&P/TSX Capped Energy Index ETF (TSE:XEG.TO) Seasonal Chart

Lundin Mining Corp. (TSE:LUN.TO) Seasonal Chart

iShares Gold Bullion ETF (TSE:CGL.TO) Seasonal Chart

iShares Canadian Corporate Bond Index ETF (TSE:XCB.TO) Seasonal Chart

SPDR Gold Shares (NYSE:GLD) Seasonal Chart
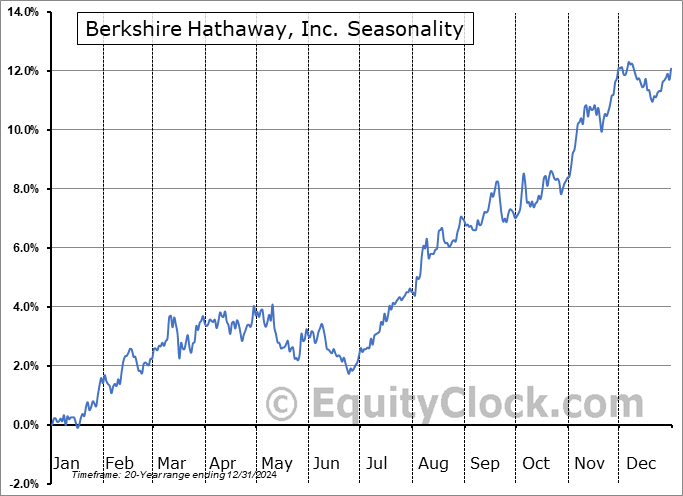
Berkshire Hathaway, Inc. (NYSE:BRK/B) Seasonal Chart
The Markets
Stocks snapped back from Wednesday’s abrupt selloff as a renewed push lower in the US Dollar provided the normal juice to prices heading into and through the Santa Claus rally period. The S&P 500 Index closed with a gain of just over one percent, trading within the range of the prior session’s sharp downside candlestick. The reprieve, unfortunately, does not eliminate the threat of a short-term pullback that Wednesday’s price action suggested, although the benchmark will have a very difficult time recording losses during the heart of the Santa Claus rally timeframe that surrounds the end of year holidays. Support beneath the market remains plentiful, including broken resistance at 4600 and major moving averages, providing many points of reference to shoot off of should the strength in the market collapse. We are still well off from seeing an intermediate-term sell signal that we may act on as part of our process and, good or bad, we will not be seeking to change our allocation to stocks and bonds within our portfolio until at least the start of the new year. Momentum indicators on the daily chart are each holding above their middle lines and moving averages are all pointed higher, both characteristics of a bullish trend.

Today, in our Market Outlook to subscribers, we discuss the following:
- A sell signal for stocks may have triggered according to our simple 12-21 strategy using the VIX
- The tendency for the equity market following negative Santa Claus Rally periods
- Manufacturer sentiment in Philadelphia
- Shipping activity and expenditures
- Dow Theory
- Weekly Jobless Claims and the health of the labor market
- Canadian Retail Sales for October and the highly abnormal decline in grocery store sales during this Thanksgiving month
Subscribers can look for this report in their inbox or by clicking on the following link and logging in: Market Outlook for December 22
Not signed up yet? Subscribe now to receive full access to all of the research and analysis that we publish.
Sentiment on Thursday, as gauged by the put call ratio, ended bullish at 0.86.

Seasonal charts of companies reporting earnings today:
- No Significant Earnings Scheduled for Today
S&P 500 Index


TSE Composite


| Sponsored By... |

|


