Stock Market Outlook for January 8, 2024

The precedent of a negative Santa Claus rally and a first week of January return is not encouraging for the prospects of the equity market through the year ahead.
*** Stocks highlighted are for information purposes only and should not be considered as advice to purchase or to sell mentioned securities. As always, the use of technical and fundamental analysis is encouraged in order to fine tune entry and exit points to average seasonal trends.
Stocks Entering Period of Seasonal Strength Today:
Subscribers Click on the relevant link to view the full profile. Not a subscriber? Signup here.

Solarwinds Corporation (NYSE:SWI) Seasonal Chart

McCormick & Co., Inc. (NYSE:MKC) Seasonal Chart

Chipotle Mexican Grill Inc. (NYSE:CMG) Seasonal Chart

Tractor Supply Co. (NASD:TSCO) Seasonal Chart

Marten Transport, Ltd. (NASD:MRTN) Seasonal Chart

Imax Corp. (NYSE:IMAX) Seasonal Chart

Invesco S&P 500 Quality ETF (AMEX:SPHQ) Seasonal Chart

Consumer Staples Select Sector SPDR Fund (NYSE:XLP) Seasonal Chart

Vanguard Global Momentum Factor ETF (TSE:VMO.TO) Seasonal Chart
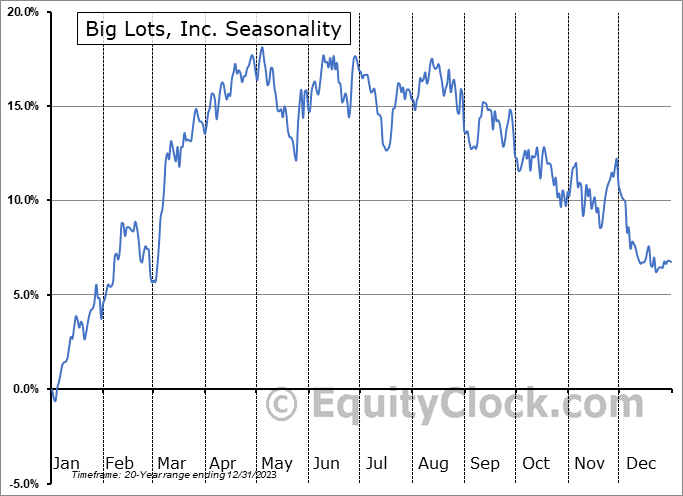
Big Lots, Inc. (NYSE:BIG) Seasonal Chart

Metro, Inc. (TSE:MRU.TO) Seasonal Chart

Atco Ltd. (TSE:ACO/X.TO) Seasonal Chart

Watsco, Inc. (NYSE:WSO) Seasonal Chart

Brookfield Asset Management, Inc. (TSE:BAM/A.TO) Seasonal Chart

Sandstorm Gold Ltd. (TSE:SSL.TO) Seasonal Chart

Franco-Nevada Corp. (TSE:FNV.TO) Seasonal Chart

iShares S&P/TSX Capped Financials Index ETF (TSE:XFN.TO) Seasonal Chart

Netflix, Inc. (NASD:NFLX) Seasonal Chart

Home Depot, Inc. (NYSE:HD) Seasonal Chart

Colgate-Palmolive Co. (NYSE:CL) Seasonal Chart

Broadcom Inc. (NASD:AVGO) Seasonal Chart
The Markets
Stocks wobbled in the final session of the first week of the year as traders debated on how to react to the much stronger than expected payroll report for December. The S&P 500 Index managed to finish the session higher by just less than two-tenths of one percent, remaining pinned below the 20-day moving average that was broken in the previous session. The one-session reprieve in selling pressures that has been observed to start the year does little to change the near-term trend back to positive and the risk remains that we will see a test of previous resistance, now support, at 4600. The intermediate-term path stemming from the October of 2022 bottom remains positive, suggesting that remaining buyers of these near-term dips remains prudent until evidence materializes that a sustainable trend lower is set to begin. Daily momentum indicators continue to alleviate the extreme overbought readings that had been derived through the middle of December, but they remain above their middle lines, which is characteristic of a bullish trend.

Today, in our Market Outlook to subscribers, we discuss the following:
- Weekly look at the large-cap benchmark
- Performance of stocks following failed Santa Claus Rally periods
- The precedent of negative first week of January returns on the equity market performance through the year ahead
- US Employment Situation
- Canada Labour Force Survey
- Investor sentiment and the pronounced plunge in investment manager exposure to stocks last week
Subscribers can look for this report in their inbox or by clicking on the following link and logging in: Market Outlook for January 8
Not signed up yet? Subscribe now to receive full access to all of the research and analysis that we publish.
Sentiment on Friday, as gauged by the put-call ratio, ended overly bearish at 1.22.

Seasonal charts of companies reporting earnings today:


S&P 500 Index


TSE Composite


| Sponsored By... |

|


