Stock Market Outlook for January 9, 2024

A wide range of benchmarks/ETFs are showing initial struggle around significant resistance following last week’s pullback.
*** Stocks highlighted are for information purposes only and should not be considered as advice to purchase or to sell mentioned securities. As always, the use of technical and fundamental analysis is encouraged in order to fine tune entry and exit points to average seasonal trends.
Stocks Entering Period of Seasonal Strength Today:
Subscribers Click on the relevant link to view the full profile. Not a subscriber? Signup here.

Invesco S&P 500 Low Volatility Index ETF (TSE:ULV-F.TO) Seasonal Chart

Corporate Office Properties Trust, LP (NYSE:CDP) Seasonal Chart

Amdocs Ltd. (NASD:DOX) Seasonal Chart

ETFIS Series Trust I Reaves Utilities ETF (AMEX:UTES) Seasonal Chart

iShares Core S&P Small-Cap ETF (NYSE:IJR) Seasonal Chart

National Storage Affiliates Trust (NYSE:NSA) Seasonal Chart
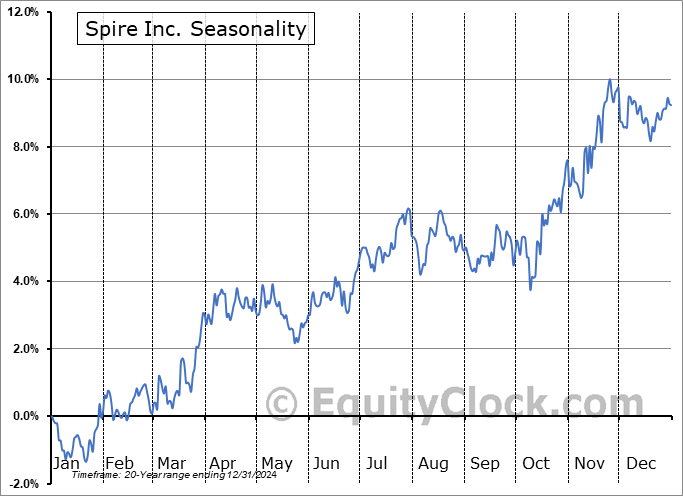
Spire Inc. (NYSE:SR) Seasonal Chart

Apogee Enterprises, Inc. (NASD:APOG) Seasonal Chart

Cinemark Holdings Corp. (NYSE:CNK) Seasonal Chart

Cummins Inc. (NYSE:CMI) Seasonal Chart

Adobe Systems, Inc. (NASD:ADBE) Seasonal Chart
The Markets
Stocks snapped back on Monday following the slump in prices that coincided with the first week of the year as investors raced back towards technology. The S&P 500 Index gained 1.41%, turning back above the rising 20-day moving average and converging again on significant resistance, as well as the all-time high, around 4800. The Relative Strength Index (RSI) is curling higher above its middle line and MACD is doing the same, maintaining characteristics of a bullish trend as we head towards the start of the fourth quarter earnings season in the days ahead. While the intermediate-term trajectory of the benchmark remains positive, it is reasonable to not expect too much of market performance in the next couple of months as we enter a softer period on the calendar for market performance. Performance for broad equity benchmarks tends to be weak through the middle of March, something that is consistent with the average path during election years. Major benchmarks have some significant hurdles to overcome in the near-term, backing the near-term uncertainty for stocks through the first couple of months of the year, but there is still no indication, yet, that the positive intermediate path of the market has been broken. This suggests remaining holders of current equity exposure and look to put new money to work on any weakness derived between now and March.

Today, in our Market Outlook to subscribers, we discuss the following:
- Wide range of benchmarks/ETFs showing reaction to significant horizontal resistance
- Health Care breaking out
- Our weekly chart books update, along with our list of all segments of the market to either Accumulate or Avoid
- Adopting an “everything but Apple” approach to growth/technology
- Comparing the heavy construction industry to the Infrastructure ETF
Subscribers can look for this report in their inbox or by clicking on the following link and logging in: Market Outlook for January 9
Not signed up yet? Subscribe now to receive full access to all of the research and analysis that we publish.
Want to know which areas of the market to buy or sell? Our Weekly Chart Books have just been updated, providing a clear Accumulate, Avoid, or Neutral rating for currencies, cryptocurrencies, commodities, broad markets, and subsectors/industries of the market. Subscribers can login and click on the relevant links to access.
- Currencies
- Cryptocurrencies
- Commodities
- Major Benchmarks
- Sub-sectors / Industries
- ETFs: Bonds | Commodities | Equity Markets | Industries | Sectors
Subscribe now.
Sentiment on Monday, according to the put-call ratio, unfortunately, was unable to be determined due to no updates provided by the CBOE. The ratio ended at an overly bearish high of 1.18 on Friday, which was the highest level since the end of October. Bearish skews, such as this, typically exhaust near-term selling pressures that this is exactly what was observed coming into this week.

Seasonal charts of companies reporting earnings today:


S&P 500 Index


TSE Composite


| Sponsored By... |

|

