Stock Market Outlook for January 16, 2024

Dollar and yields showing a short-term divergence against one another, something that would become abnormal if it persists beyond the first quarter.
*** Stocks highlighted are for information purposes only and should not be considered as advice to purchase or to sell mentioned securities. As always, the use of technical and fundamental analysis is encouraged in order to fine tune entry and exit points to average seasonal trends.
Stocks Entering Period of Seasonal Strength Today:
Subscribers Click on the relevant link to view the full profile. Not a subscriber? Signup here.

Brown-Forman Corp. – Class B (NYSE:BF/B) Seasonal Chart

Akamai Technologies, Inc. (NASD:AKAM) Seasonal Chart
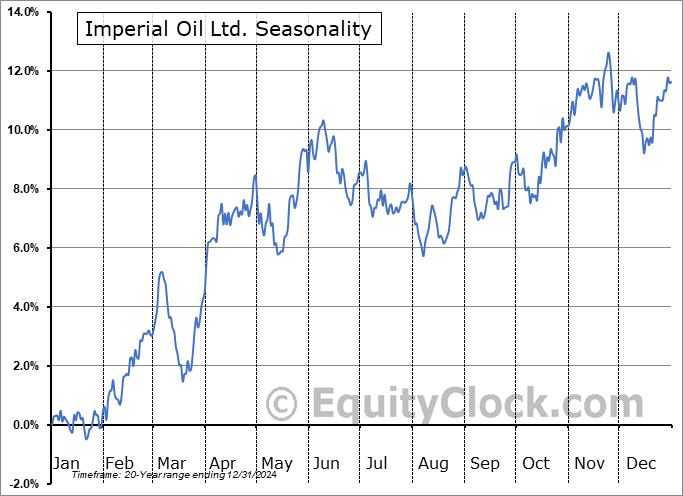
Imperial Oil Ltd. (TSE:IMO.TO) Seasonal Chart

Kirby Corp. (NYSE:KEX) Seasonal Chart

Monolithic Power Systems, Inc. (NASD:MPWR) Seasonal Chart

BMO Global Infrastructure Index ETF (TSE:ZGI.TO) Seasonal Chart

O’Reilly Automotive, Inc. (NASD:ORLY) Seasonal Chart

Saputo Group, Inc. (TSE:SAP.TO) Seasonal Chart

iShares Canadian Growth Index ETF (TSE:XCG.TO) Seasonal Chart

iShares S&P GSCI Commodity-Indexed Trust (NYSE:GSG) Seasonal Chart

Waste Connections, Inc. (TSE:WCN.TO) Seasonal Chart

SPDR S&P Retail ETF (NYSE:XRT) Seasonal Chart
Note: Due to the Martin Luther King, Jr. Holiday closure of US Markets on Monday, our next report will be released on Tuesday
The Markets
Stocks closed mixed on Friday as traders held the tape steady following a lacklustre perception to fourth quarter earnings from some of the big banks. The S&P 500 Index closed with a gain of just less than a tenth of one percent, continuing to sit just below significant horizontal resistance at the all-time high of 4800. Short-term support remains at the rising 20-day moving average that currently hovers at 4747. While momentum indicators rebounded in the past week, they are showing difficulty breaking out of their short-term decline that was derived from the rollover from overbought territory through the middle of December. Characteristics of a bullish trend remain with both RSI and MACD remaining above their middle lines. Short-term uncertainties pertaining to the market’s path persist, but the intermediate trend, which is our focus according to our seasonal strategy, remains definitively positive.

Today, in our Market Outlook to subscribers, we discuss the following:
- Weekly look at the large-cap benchmark
- US Producer Price Index (PPI)
- Treasury Breakeven Inflation rates and the relative performance of the Treasury Inflation Protected Securities ETF (TIP) versus the Intermediate Treasury Bond fund
- Ongoing injection of liquidity in the market and when this fuel to equity market performance could be exhausted
- Divergence between the direction of the US Dollar and Yields and when to be concerned of the opposing trajectories
- Our view of the US Dollar and the Commitment of Traders (COT) to the currency futures
Subscribers can look for this report in their inbox or by clicking on the following link and logging in: Market Outlook for January 16
Not signed up yet? Subscribe now to receive full access to all of the research and analysis that we publish.
Sentiment on Friday, as gauged by the put-call ratio, ended slightly bullish at 0.90.

Seasonal charts of companies reporting earnings today:

 Seasonal Chart")
 Seasonal Chart")


S&P 500 Index


TSE Composite


| Sponsored By... |

|

