Stock Market Outlook for January 22, 2024

While the S&P 500 Index has broken above significant resistance and is now higher on the year, the average stock is still showing a decline, so far, in 2024.
*** Stocks highlighted are for information purposes only and should not be considered as advice to purchase or to sell mentioned securities. As always, the use of technical and fundamental analysis is encouraged in order to fine tune entry and exit points to average seasonal trends.
Stocks Entering Period of Seasonal Strength Today:
Subscribers Click on the relevant link to view the full profile. Not a subscriber? Signup here.

Ulta Beauty, Inc. (NASD:ULTA) Seasonal Chart

Kilroy Realty Corp. (NYSE:KRC) Seasonal Chart

Meritage Homes Corp. (NYSE:MTH) Seasonal Chart

Steven Madden, Ltd. (NASD:SHOO) Seasonal Chart
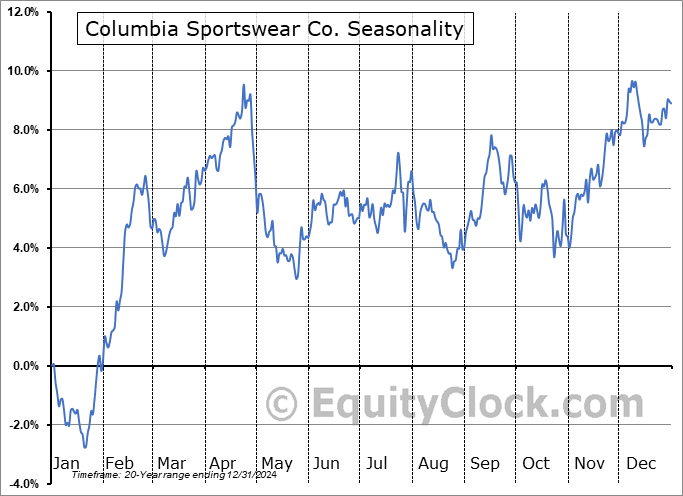
Columbia Sportswear Co. (NASD:COLM) Seasonal Chart

e.l.f. Beauty, Inc. (NYSE:ELF) Seasonal Chart

SPDR MSCI USA StrategicFactors ETF (AMEX:QUS) Seasonal Chart

CSX Corp. (NASD:CSX) Seasonal Chart

MercadoLibre Inc. (NASD:MELI) Seasonal Chart

Invesco DB Energy Fund (NYSE:DBE) Seasonal Chart

Invesco S&P SmallCap Consumer Staples ETF (NASD:PSCC) Seasonal Chart

American Express Co. (NYSE:AXP) Seasonal Chart

Coca Cola Co. (NYSE:KO) Seasonal Chart

Companhia Energetica de Minas Gerais (Cemig) (NYSE:CIG) Seasonal Chart

Invesco DB Commodity Index Tracking Fund (NYSE:DBC) Seasonal Chart

Invesco Dynamic Software ETF (NYSE:IGPT) Seasonal Chart
The Markets
Stocks rallied on Friday as growth stocks propelled the S&P 500 Index to a fresh all-time high after two years of being capped below resistance at 4800. The large-cap benchmark gained 1.23%, moving almost 40-points above the previous barrier. Short-term support has been redefined at the rising 20-day moving average, now at 4756. As highlighted in our last report, the break above significant resistance at 4800 has a 100-point potential above the previous threshold, which implies an initial upside target to 4900. Of course, with no points of resistance overhead, the potential seems almost limitless. Momentum indicators are showing signs of curling higher from their recent slide out of overbought territory, still holding levels above their middle lines, which is characteristic of a bullish trend. The intermediate-term trend (spanning weeks and months) stemming from the October of 2022 low remains firmly intact and now the breakout above resistance at 4800 reinvigorates the long-term path, which has been capped since the start of 2022.

Today, in our Market Outlook to subscribers, we discuss the following:
- Weekly look at the large-cap benchmark
- The divergence in the performance of the capitalization weighted and equally weighted S&P 500 indexes
- US Existing Home Sales
- US Shipping Volumes and Expenditures and the warning they are presenting pertaining to the health of the economy
- Dow Jones Transportation Average
- Canadian Retail Sales
Subscribers can look for this report in their inbox or by clicking on the following link and logging in: Market Outlook for January 22
Not signed up yet? Subscribe now to receive full access to all of the research and analysis that we publish.
Sentiment on Friday, as gauged by the put-call ratio, ended slightly bullish at 0.91.

Seasonal charts of companies reporting earnings today:


S&P 500 Index


TSE Composite


| Sponsored By... |

|


