Stock Market Outlook for January 25, 2024

Days of supply of gasoline is showing the second highest level for the middle of January in three decades as the demand profile in the energy market looks distinctly different than the past few years.
*** Stocks highlighted are for information purposes only and should not be considered as advice to purchase or to sell mentioned securities. As always, the use of technical and fundamental analysis is encouraged in order to fine tune entry and exit points to average seasonal trends.
Stocks Entering Period of Seasonal Strength Today:
Subscribers Click on the relevant link to view the full profile. Not a subscriber? Signup here.
Altair Engineering, Inc. (NASD:ALTR) Seasonal Chart
Hartford Financial Services Group, Inc. (NYSE:HIG) Seasonal Chart
Aon Corp. (NYSE:AON) Seasonal Chart
The Markets
Stocks closed rather mixed on Wednesday as weakness in core-defensive sectors (Staples, Utilities, REITs) overwhelmed strength in the traditional growth segments of Technology and Communications Services. The S&P 500 Index closed with a gain of just less than a tenth of one percent after reaching a high of 4900 earlier in the session. (The high of the day was our proposed upside target following the break above significant resistance at 4800.) Despite the reversal, a new all-time high is still the result and, as the market starts talking about the next psychologically important level of 5000, the large-cap benchmark may start to feel the pull higher as investors are more cognizant of their portfolios at these record heights. The market loves big, important round numbers and they will tend to act like a magnet to prices until they are achieved and the conversation around them ends. The benchmark is still showing characteristics of a bullish intermediate-term trend with major moving averages showing parallel paths higher and momentum indicators above their middle lines. The Relative Strength Index (RSI) is reaching back into overbought territory above 70, while short-term support remains persistent at the rising 20-day moving average (4776).
Today, in our Market Outlook to subscribers, we discuss the following:
- Investors showing no inclination of rotating into core-defensive sectors
- The trend of revenue and net income is very clear about where to invest in this market are where to avoid
- The supply/demand backdrop in the energy market
Subscribers can look for this report in their inbox or by clicking on the following link and logging in: Market Outlook for January 25
Not signed up yet? Subscribe now to receive full access to all of the research and analysis that we publish.
Sentiment on Wednesday, as gauged by the put-call ratio, ended neutral at 0.98.
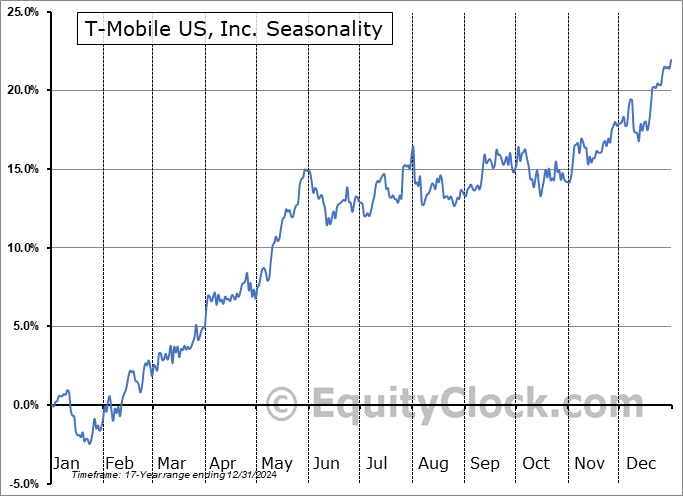
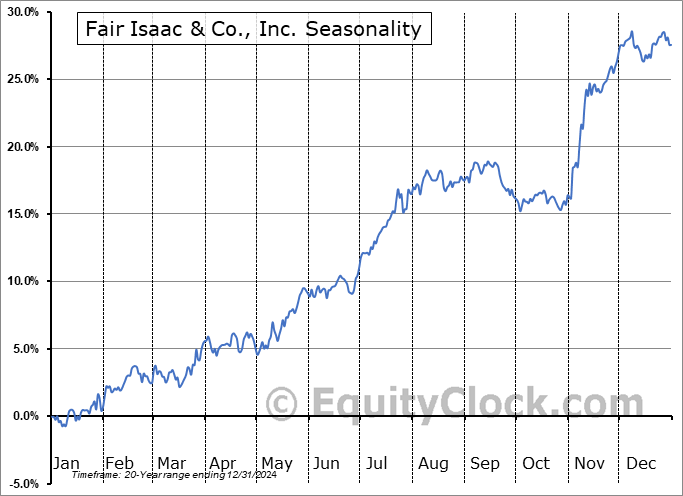
Seasonal charts of companies reporting earnings today:
S&P 500 Index
TSE Composite
| Sponsored By... |

|


