Stock Market Outlook for January 30, 2024

Looking for opportunities in recent laggards as market breadth expands.
*** Stocks highlighted are for information purposes only and should not be considered as advice to purchase or to sell mentioned securities. As always, the use of technical and fundamental analysis is encouraged in order to fine tune entry and exit points to average seasonal trends.
Stocks Entering Period of Seasonal Strength Today:
Subscribers Click on the relevant link to view the full profile. Not a subscriber? Signup here.

Element Solutions Inc. (NYSE:ESI) Seasonal Chart

LiveOne, Inc. (NASD:LVO) Seasonal Chart

Hamilton Thorne Ltd. (TSE:HTL.TO) Seasonal Chart

CONSOL Energy Inc. (NYSE:CEIX) Seasonal Chart

PureFunds ISE Cyber Security ETF (AMEX:HACK) Seasonal Chart
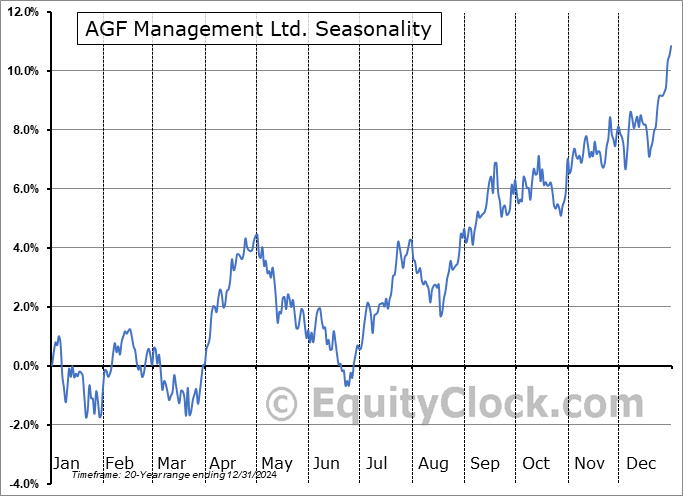
AGF Management Ltd. (TSE:AGF/B.TO) Seasonal Chart

Entegris, Inc. (NASD:ENTG) Seasonal Chart

Encore Wire Corp. (NASD:WIRE) Seasonal Chart

Chart Industries Inc. (NYSE:GTLS) Seasonal Chart

EnerSys Inc. (NYSE:ENS) Seasonal Chart
The Markets
Stocks started the week off on a positive note following news that the US Treasury would have to raise less funds than expected to finance its obligations through the quarters ahead. The news sent treasury yields firmly lower and equity prices firmly higher, resulting in a gain for the S&P 500 Index of just over three-quarters of one percent. The large-cap benchmark continues to become increasingly overbought with the Relative Strength Index (RSI) now above 75, a level that is higher than the overbought extreme that was charted in the back half of July. While the overbought extreme could easily exhaust near-term buying demand, characteristics of a bullish trend are still firmly entrenched with momentum indicators above their middle lines and moving averages each rising alongside one another. Short-term support can continue to be pegged at the rising 20-day moving average (4794). Investor focus is increasingly turning to the psychologically important 5000 level, a hurdle that is likely to act as a magnet until achieved, so long as the conversation of new all-time highs in equity prices remains positive. That big round number could easily be achieved in the next couple of weeks and the technicals are suggesting that we could get there through a rotation of market exposure, away from the former growth darlings and towards a broader spectrum of exposure. More on that below.

Want to know which areas of the market to buy or sell? Our Weekly Chart Books have just been updated, providing a clear Accumulate, Avoid, or Neutral rating for currencies, cryptocurrencies, commodities, broad markets, and subsectors/industries of the market. Subscribers can login and click on the relevant links to access.
- Currencies
- Cryptocurrencies
- Commodities
- Major Benchmarks
- Sub-sectors / Industries
- ETFs: Bonds | Commodities | Equity Markets | Industries | Sectors
Subscribe now.
Today, in our Market Outlook to subscribers, we discuss the following:
- Our weekly chart books update, along with our list of all segments of the market to either Accumulate or Avoid
- Small-Caps
- Biotechnology
- The Ark Innovation ETF
- Semiconductors
Subscribers can look for this report in their inbox or by clicking on the following link and logging in: Market Outlook for January 30
Not signed up yet? Subscribe now to receive full access to all of the research and analysis that we publish.
Soon to be released…
We are busy placing the finishing touches on our Monthly Outlook for February, providing you with all of the insight that you need to navigate this market through the month(s) ahead. Subscribers can look for this extensive report in their inbox in the day ahead.
Sentiment on Monday, as gauged by the put-call ratio, ended close to neutral at 0.94.

Seasonal charts of companies reporting earnings today:


S&P 500 Index


TSE Composite


| Sponsored By... |

|

