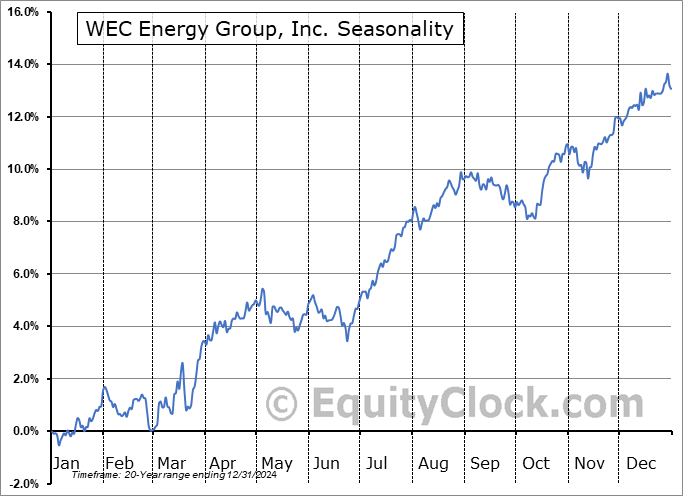
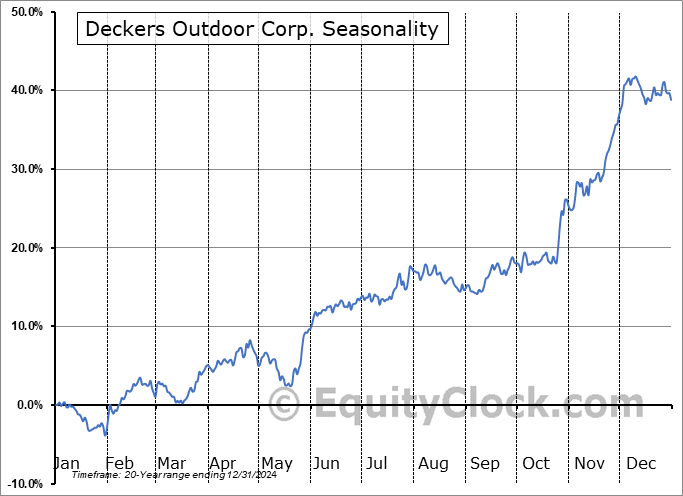
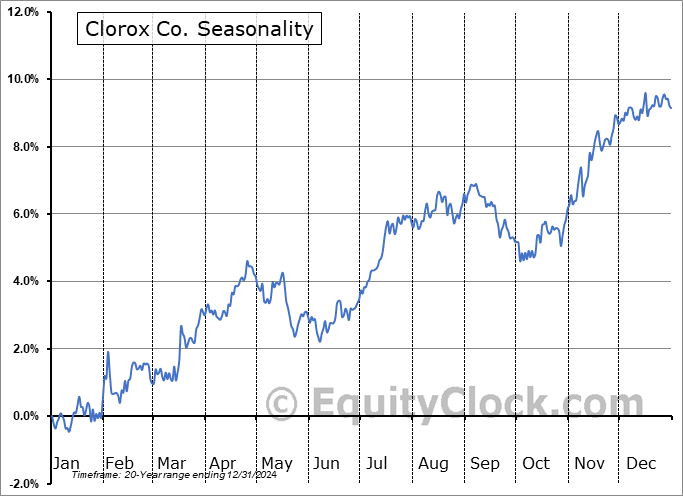
Stock Market Outlook for February 1, 2024

Equity market performance in the month of February is typically nothing notable with the S&P 500 Index averaging a loss of 0.1%, based on data from the past two decades.
*** Stocks highlighted are for information purposes only and should not be considered as advice to purchase or to sell mentioned securities. As always, the use of technical and fundamental analysis is encouraged in order to fine tune entry and exit points to average seasonal trends.
Stocks Entering Period of Seasonal Strength Today:
Subscribers Click on the relevant link to view the full profile. Not a subscriber? Signup here.
Allstate Corp. (NYSE:ALL) Seasonal Chart
McCormick & Co., Inc. (NYSE:MKC) Seasonal Chart
Roper Technologies, Inc. (NASD:ROP) Seasonal Chart
1-800 FLOWERS.COM, Inc. (NASD:FLWS) Seasonal Chart
Tourmaline Oil Corp. (TSE:TOU.TO) Seasonal Chart
iShares S&P/TSX Capped Consumer Staples Index ETF (TSE:XST.TO) Seasonal Chart
Invesco DB Oil Fund (NYSE:DBO) Seasonal Chart
SunLink Health Systems, Inc. (AMEX:SSY) Seasonal Chart
WisdomTree U.S. Quality Dividend Growth Variably Hedged Index ETF (TSE:DQD.TO) Seasonal Chart
The Markets
Stocks dropped on Wednesday as investors sold off big-tech stocks following earnings and reacted to statements from Fed Chair Jerome Powell, who poured cold water on the prospect of seeing a rate cut as early as March. The S&P 500 Index ended down by 1.61%, realizing the worst single session decline since September amidst the third quarter pullback. The loss on the day certainly imposes a threatening look to the short-term trend, something that was at risk anyways given how overbought the market had become, but there is certainly no damage being inflicted on the intermediate-term path, yet. The benchmark remains above previous resistance at 4800 that capped upside momentum for the past couple of years and major moving averages remain firmly below present levels. While the Relative Strength Index (RSI) has pulled back out of overbought territory, characteristics of a bullish trend remain with both MACD and RSI above their middle lines. What does raise a point of concern pertaining to the intermediate-term path is the possible lower-high of both RSI and MACD below their December highs, threatening to reveal a divergence versus price. If confirmed, this would be indicative of waning upside momentum, a potential precursor to a more substantial pullback ahead. December’s RSI and MACD readings set a high bar, therefore it seemed likely that the benchmark would not be able to overcome that previous threshold. The last negative momentum divergence that was observed with respect to these indicators was recorded in July, ahead of the correction that played out in stocks through the remainder of the third quarter. The difference between now and then is that back in July investor sentiment was overly bullish and highlighted complacency, while current sentiment readings are pointing to a more neutral bias. This is not the setup, yet, to be bearish of stocks over a sustained timeframe, although we could be setting up for such a shift of trend ahead.
Today, in our Market Outlook to subscribers, we discuss the following:
- Monthly look at the large-cap benchmark
- Tendency for stocks in the month of February
- Assets classes that may provide a better choice to an equity allocation in the month ahead
- Stocks that have gained or lost in every February over their trading history
- Canada Gross Domestic Product (GDP)
Subscribers can look for this report in their inbox or by clicking on the following link and logging in: Market Outlook for February 1
Not signed up yet? Subscribe now to receive full access to all of the research and analysis that we publish.
For the month ahead, based on the past two decades, the second month of the year is typically nothing notable for equity performance, at least looking at the month overall. The S&P 500 Index has lost an average of 0.1% in February with 60% of periods over the past 20 years showing a gain. The 11.0% decline recorded in February of 2009 is a significant burden on the average result. On the flipside, the best return for the second month of the year was realized in 2015 when the benchmark gained 5.5%. We provide more insight on what to expect for the month ahead in our just released Market Outlook for the month of February. Subscribe now.
Just released…
Our monthly outlook for February is out, providing you with everything that you need to know to navigate through the month(s) ahead.
Highlights in this report include:
- Equity market tendencies in the month of February
- Yield Curve
- Technicals for bonds still bullish amidst this period of seasonal strength
- Managed money still short the bond market
- Rising liquidity in the market is bullish for stocks
- US Dollar headwind against stocks expected to persist into February
- Rising earnings expectations
- Using the Citigroup Economic Surprise Index to gauge how “on point” analysts are with their expectations
- Disinflationary pressures showing evidence of plateauing
- Good potential for a broadening out of equity exposure beyond just growth in the months ahead
- The risk to seasonal trades that depend on strength in China surrounding the New Year
- Precious Metals
- Second Weakest December change in Retail Sales on record
- Visa Spending Momentum Index
- Existing Home Sales
- Shipping Activity
- Manufacturer sentiment remains akin to past recessionary periods
- Copper-Gold Ratio
- Our list of all segments of the market to either Accumulate or Avoid, along with relevant ETFs
- Positioning for the months ahead
- Sector Reviews and Ratings
- Stocks that have Frequently Gained in the Month of February
- Notable Stocks and ETFs Entering their Period of Strength in February
Subscribers can look for this 111-page report in their inbox and, soon, in the report archive.
Not subscribed yet? Signup now to receive access to this report and all of the research that we publish.
With the new month upon us and as we celebrate the release of our monthly report for February, today we release our screen of all of the stocks that have gained in every February over their trading history. While we at Equity Clock focus on a three-pronged approach (seasonal, technical, and fundamental analysis) to gain exposure to areas of the market that typically perform well over intermediate (2 to 6 months) timeframes, we know that stocks that have a 100% frequency of success for a particular month is generally of interest to those pursuing a seasonal investment strategy. Below are the results:
And how about those securities that have never gained in this second month of the year, here they are:
*Note: None of the results highlighted above have the 20 years of data that we like to see in order to accurately gauge the annual recurring, seasonal influences impacting an investment, therefore the reliability of the results should be questioned. We present the above list as an example of how our downloadable spreadsheet available to yearly subscribers can be filtered.
Sentiment on Wednesday, as gauged by the put-call ratio, ended close to neutral at 0.93.
Seasonal charts of companies reporting earnings today:
S&P 500 Index
TSE Composite
| Sponsored By... |

|


