Stock Market Outlook for February 2, 2024

The Nonfarm Payroll report could show a near record setting January decline, but this would be entirely normal.
*** Stocks highlighted are for information purposes only and should not be considered as advice to purchase or to sell mentioned securities. As always, the use of technical and fundamental analysis is encouraged in order to fine tune entry and exit points to average seasonal trends.
Stocks Entering Period of Seasonal Strength Today:
Subscribers Click on the relevant link to view the full profile. Not a subscriber? Signup here.

International Seaways, Inc. (NYSE:INSW) Seasonal Chart

Dynamic iShares Active Canadian Dividend ETF (TSE:DXC.TO) Seasonal Chart

BMO Low Volatility US Equity Hedged to CAD ETF (TSE:ZLH.TO) Seasonal Chart

Vanguard Global Momentum Factor ETF (TSE:VMO.TO) Seasonal Chart

Mackenzie Maximum Diversification US ETF (TSE:MUS.TO) Seasonal Chart
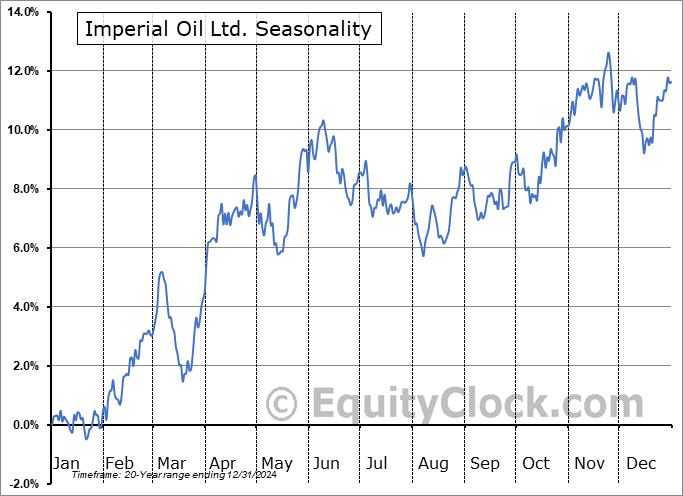
Imperial Oil Ltd. (TSE:IMO.TO) Seasonal Chart

United States 12 Month Oil Fund, LP (NYSE:USL) Seasonal Chart

Genesis Land Development Corp. (TSE:GDC.TO) Seasonal Chart

Scorpio Tankers Inc. (NYSE:STNG) Seasonal Chart

Baytex Energy Corp. (TSE:BTE.TO) Seasonal Chart

Peyto Exploration & Development Corp. (TSE:PEY.TO) Seasonal Chart

Transcontinental Realty Investors Inc. (NYSE:TCI) Seasonal Chart

Grayscale Bitcoin Trust (OTCMKT:GBTC) Seasonal Chart

Upbound Group, Inc. (NASD:UPBD) Seasonal Chart
The Markets
Stocks snapped back from their Wednesday selloff as investors looked forward to big-tech earnings released after Thursday’s closing bell. The S&P 500 Index closed with a gain of 1.25%, ending back at the high of the previous day’s session. Despite the rebound, MACD continues to encroach on its signal line, threatening to confirm a negative divergence with respect to this indicator versus price, something that would signal waning upside momentum. This is the short-term risk that buying exhaustion takes hold as we progress through what is typically a lacklustre month for equity performance in February. From an intermediate-term perspective, which is the wheelhouse that our seasonal strategy operates in, there is very little to do from an equity allocation standpoint with characteristics of a bullish trend remaining intact. Momentum indicators are holding above their middle lines and major moving averages all remain on the rise. The draw towards the psychologically important 5000 level on the large-cap benchmark remains a catalyst for the benchmark, so long as the public conversation pertaining to the market in all-time high territory, heading towards that important milestone, persists. Seasonal norms for stocks suggest strength in the first half of February followed by weakness in the last half, producing a rather dismal return for the month, overall.

Today, in our Market Outlook to subscribers, we discuss the following:
- The downfall of regional bank stocks and the renewed threat of contagion
- Technicals of big US bank stocks still looking favourable, for now
- Credit spreads showing hints of a short-term bottom
- Emerging risk aversion in the market
- Weekly Jobless Claims and the health of the labor market
- What to expect of the Nonfarm Payroll report on Friday
- US Construction Spending and a theme that warrants ongoing attention in portfolios
Subscribers can look for this report in their inbox or by clicking on the following link and logging in: Market Outlook for February 2
Not signed up yet? Subscribe now to receive full access to all of the research and analysis that we publish.
Sentiment on Thursday, as gauged by the put-call ratio, ended slightly bearish at 1.01.

Seasonal charts of companies reporting earnings today:


 Seasonal Chart")

S&P 500 Index


TSE Composite


| Sponsored By... |

|

