Stock Market Outlook for February 6, 2024

The optimal holding period for the Bitcoin ETF starts today, but increasing negativity around the periphery of the cryptocurrency market is expressing threats.
*** Stocks highlighted are for information purposes only and should not be considered as advice to purchase or to sell mentioned securities. As always, the use of technical and fundamental analysis is encouraged in order to fine tune entry and exit points to average seasonal trends.
Stocks Entering Period of Seasonal Strength Today:
Subscribers Click on the relevant link to view the full profile. Not a subscriber? Signup here.

Invesco S&P 500 Low Volatility ETF (NYSE:SPLV) Seasonal Chart

VictoryShares US Multi-Factor Minimum Volatility ETF (NASD:VSMV) Seasonal Chart

Kimbell Royalty Partners, LP (NYSE:KRP) Seasonal Chart

Utilities Select Sector SPDR Fund (NYSE:XLU) Seasonal Chart

Vanguard Consumer Staples ETF (NYSE:VDC) Seasonal Chart

Dollar Tree, Inc. (NASD:DLTR) Seasonal Chart

Invesco Dynamic Food & Beverage ETF (NYSE:PBJ) Seasonal Chart

UFP Technologies, Inc. (NASD:UFPT) Seasonal Chart
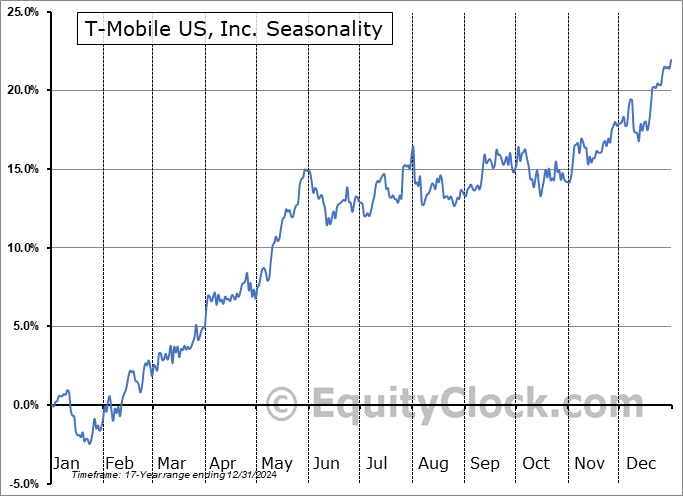
T-Mobile US, Inc. (NASD:TMUS) Seasonal Chart
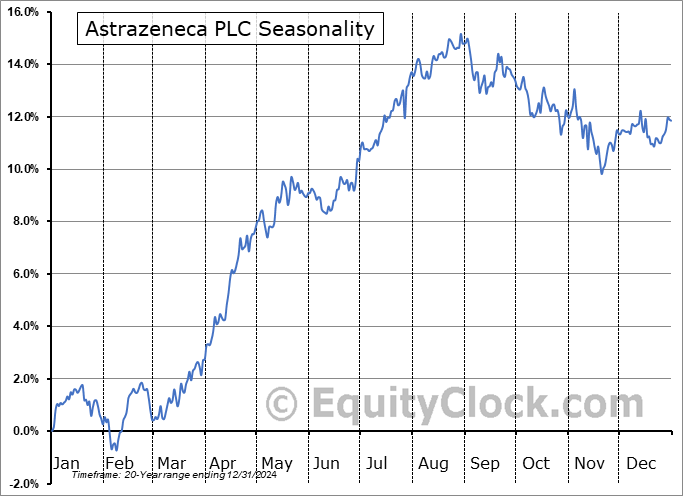
Astrazeneca PLC (NASD:AZN) Seasonal Chart

Credicorp Ltd. (NYSE:BAP) Seasonal Chart

Carter Holdings Inc. (NYSE:CRI) Seasonal Chart
The Markets
Stocks closed generally lower on Monday amidst a spike in the US dollar and interest rates following Friday’s hotter than expected read of employment in the US and recent comments from Fed Chair Jerome Powell who poured cold water on the prospect of an imminent cut in the cost of borrowing. The S&P 500 Index ended down by around a third of one percent, trading within the range of Friday’s upside candlestick. Short-term support remains well defined around the rising 20-day moving average (4843) as the pull towards the psychologically important 5000 level continues. Momentum indicators remain above their middle lines and major moving averages are trending higher above one another, both characteristics of a bullish trend. Seasonal tendencies call for strength through the first half of February followed by weakness through the back half, amounting to a lacklustre month, overall, for stocks ahead of the next ramp higher in the market through March and April. The positive intermediate view of the benchmark, aligning with the timeframe of our seasonal bias, continues to leave us with little to do in portfolios while we wait for the next significant shift in direction.

Today, in our Market Outlook to subscribers, we discuss the following:
- The rollover of liquidity being provided to the market
- Our weekly chart books update, along will all areas of the market to either Accumulate or Avoid
- The topping pattern in the Materials sector
- New multi-year relative lows for key cyclical segments of the market
Subscribers can look for this report in their inbox or by clicking on the following link and logging in: Market Outlook for February 6
Not signed up yet? Subscribe now to receive full access to all of the research and analysis that we publish.
Sentiment on Monday,as gauged by the put-call ratio, ended close to neutral at 0.94.

Seasonal charts of companies reporting earnings today:


S&P 500 Index


TSE Composite


| Sponsored By... |

|


