Stock Market Outlook for February 15, 2024

Over the next month, the Volatility Index (VIX) has averaged a sharp rise amidst one of the weakest two-week spans for stocks during the year.
*** Stocks highlighted are for information purposes only and should not be considered as advice to purchase or to sell mentioned securities. As always, the use of technical and fundamental analysis is encouraged in order to fine tune entry and exit points to average seasonal trends.
Stocks Entering Period of Seasonal Strength Today:
Subscribers Click on the relevant link to view the full profile. Not a subscriber? Signup here.

Invesco S&P 500 Equal Weight Utilities ETF (NYSE:RSPU) Seasonal Chart

Cambria Tail Risk ETF (AMEX:TAIL) Seasonal Chart

Pangaea Logistics Solutions Ltd. (NASD:PANL) Seasonal Chart

iShares U.S. Utilities ETF (NYSE:IDU) Seasonal Chart

Invesco S&P International Developed Low Volatility ETF (AMEX:IDLV) Seasonal Chart

iShares Currency Hedged MSCI Germany ETF (NASD:HEWG) Seasonal Chart

SPDR S&P International Dividend ETF (NYSE:DWX) Seasonal Chart

iShares Edge MSCI Minimum Volatility Global ETF (AMEX:ACWV) Seasonal Chart

BMO Long Federal Bond Index ETF (TSE:ZFL.TO) Seasonal Chart

BMO MSCI Europe High Quality Hedged to CAD Index ETF (TSE:ZEQ.TO) Seasonal Chart

iShares Diversified Monthly Income ETF (TSE:XTR.TO) Seasonal Chart

iShares Global Consumer Staples ETF (NYSE:KXI) Seasonal Chart

West Pharmaceutical Services (NYSE:WST) Seasonal Chart

Mine Safety Appliances Co. (NYSE:MSA) Seasonal Chart

BCE, Inc. (TSE:BCE.TO) Seasonal Chart

George Weston Ltd. (TSE:WN.TO) Seasonal Chart
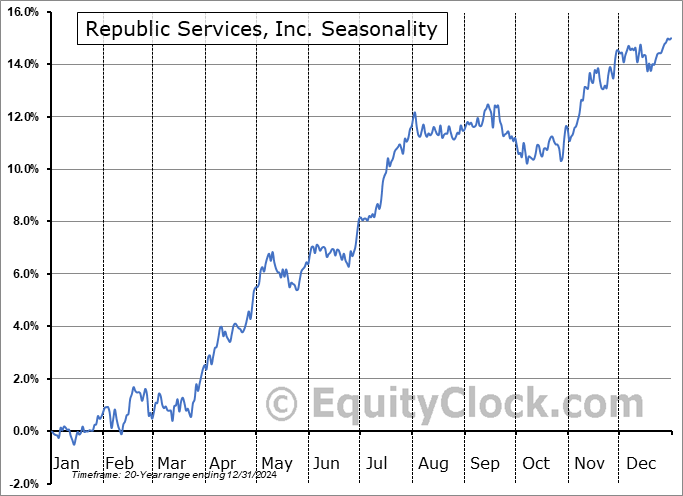
Republic Services, Inc. (NYSE:RSG) Seasonal Chart

Johnson & Johnson (NYSE:JNJ) Seasonal Chart

Dominion Energy, Inc. (NYSE:D) Seasonal Chart

Fortis Inc. (NYSE:FTS) Seasonal Chart

iShares Residential Real Estate Capped ETF (NYSE:REZ) Seasonal Chart
The Markets
Stocks rebounded slightly from Tuesday’s selloff, attempting to close some of the downside gaps that had been opened in the prior session. The S&P 500 Index closed with a gain of nearly one percent, intersecting with recently minted resistance around 5000. Short-term support is being maintained at the rising 20-day moving average (4920). A negative divergence with respect to MACD suggests waning upside momentum, particularly now that a bearish cross of the momentum indicator with its signal line has been confirmed at level below the prior peak set at the end of last year. The last divergence of this nature was recorded at the end of July, just prior to the significant correction in stocks that spanned the remainder of the third quarter. But while this raises near-term concern as we head into what is normally a weak period seasonally through the back half of February, intermediate-term technicals are all maintaining characteristics of a bullish trend, keeping us limited on how we can shuffle risk exposure in portfolios according to our seasonal investment strategy. The best course of action is to lower portfolio sensitivity to the broader market while remaining on the lookout for signals that could warrant a more negative stance over a prolonged timeframe. The next uptick in equity prices coinciding with the tail-end to the best six months of the year for stocks that started at the end of October runs through March and April and, despite near-term caution, we do not have any reason at present to suspect that this cap to the broader seasonal trend will fail.

Today, in our Market Outlook to subscribers, we discuss the following:
- Seasonal rise in the Volatility Index (VIX) through the month ahead
- The break of the trend of outperformance on the Dow Jones Industrial Average
- Ark Innovation ETF
Subscribers can look for this report in their inbox or by clicking on the following link and logging in: Market Outlook for February 15
Not signed up yet? Subscribe now to receive full access to all of the research and analysis that we publish.
Sentiment on Wednesday, as gauged by the put-call ratio, ended closed to neutral at 0.95.

Sectors and Industries entering their period of seasonal strength:


Analysis of the Business Support Services Industry seasonal charts above shows that a Buy Date of February 15 and a Sell Date of July 2 has resulted in a geometric average return of 2.19% above the benchmark rate of the S&P 500 Total Return Index over the past 20 years. This seasonal timeframe has shown positive results compared to the benchmark in 16 of those periods. This is a very good rate of success and the return outperforms the relative buy-and-hold performance of the stock over the past 20 years by an average of 1.29% per year.
Seasonal charts of companies reporting earnings today:


 Seasonal Chart")


S&P 500 Index


TSE Composite


| Sponsored By... |

|


