Stock Market Outlook for February 21, 2024

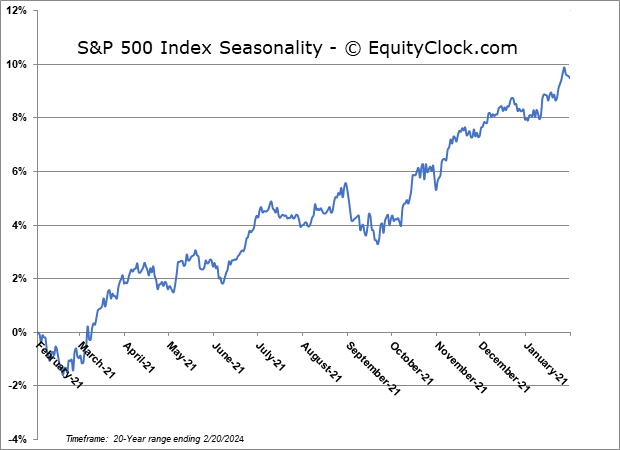
Signs of upside exhaustion in growth sectors has made the market vulnerable to pulling back in the near-term, a scenario aligned with seasonal norms.
*** Stocks highlighted are for information purposes only and should not be considered as advice to purchase or to sell mentioned securities. As always, the use of technical and fundamental analysis is encouraged in order to fine tune entry and exit points to average seasonal trends.
Stocks Entering Period of Seasonal Strength Today:
Subscribers Click on the relevant link to view the full profile. Not a subscriber? Signup here.

Equinix, Inc. (NASD:EQIX) Seasonal Chart

Shenandoah Telecommunications Co. (NASD:SHEN) Seasonal Chart

Teucrium Wheat Fund (NYSE:WEAT) Seasonal Chart

Coterra Energy Inc. (NYSE:CTRA) Seasonal Chart

iShares Convertible Bond Index ETF (TSE:CVD.TO) Seasonal Chart
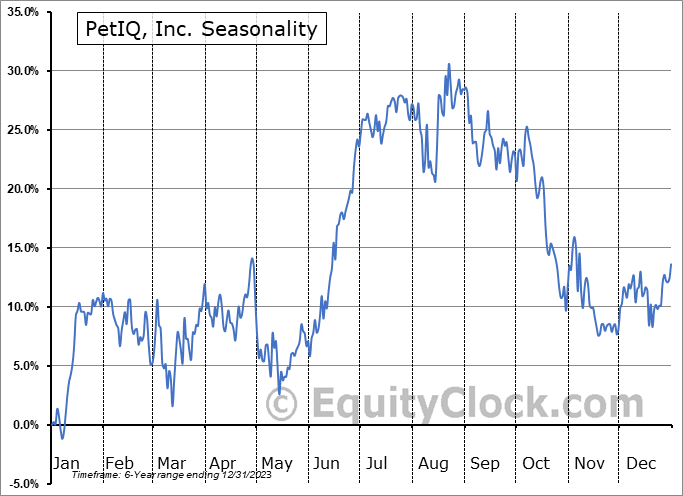
PetIQ, Inc. (NASD:PETQ) Seasonal Chart
The Markets
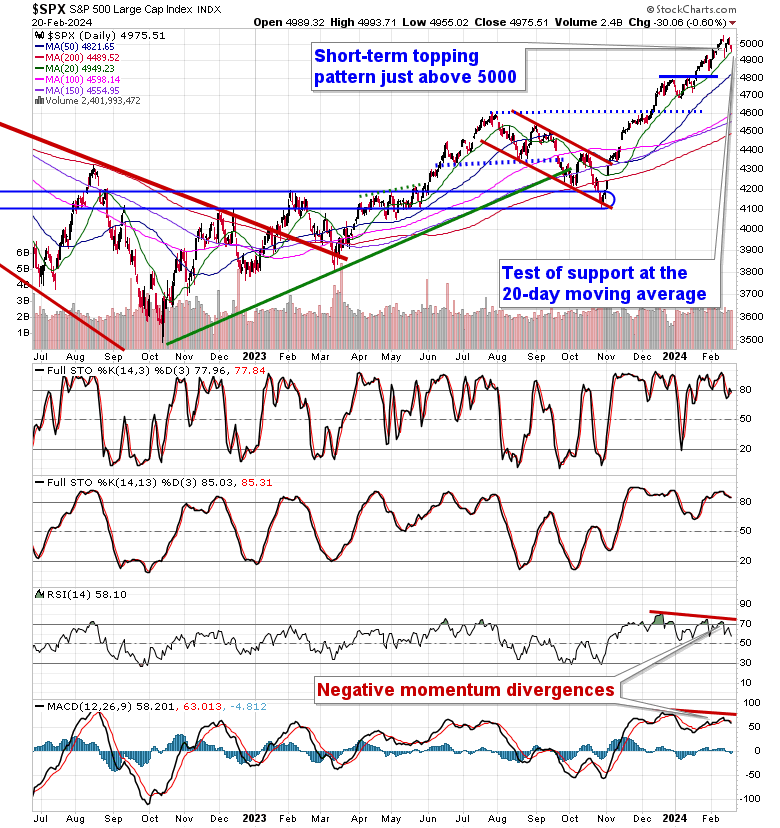
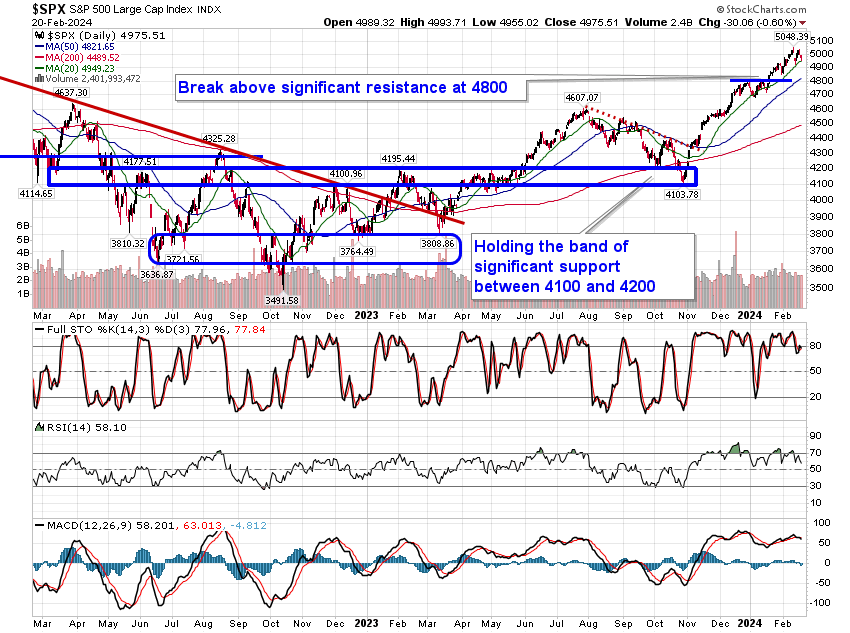
Stocks pulled back on Tuesday as traders booked profits in many of their winners in the technology sector as the one of the weakest two week stretches of the year for the market gets underway. The S&P 500 Index closed lower by six-tenths of one percent, reaching back to short-term support at the 20-day moving average (4948). Tuesday’s downturn starts to confirm a short-term lower-high below the peak set at 5048 on February 12th and another downside gap at 5000 emphasizes the significance of this level to market participants. Momentum indicators (MACD and RSI) continue to show a negative divergence versus price, highlighting waning buying pressures at these market heights, setting the stage for the short-term pullback that is now underway. Despite the high likelihood of the near-term pullback, aligning with seasonal norms for the back half of February, intermediate-term technical indicators remain positive with momentum indicators holding predominantly above their middle lines and major moving averages trending higher above one another. As highlighted in our Market Outlook last week, levels down to 4600 on the large-cap benchmark are fair game as part of a near-term pullback, although a heightened level of scrutiny will be given around the previous all-time high and suspected support at 4800. A correction of 5% to 10%, which a pullback to 4600 would represent, is normal in any intermediate-term bull market trend and we are likely seeing the start of this evolution now. The period of seasonal weakness in the equity market spans the last couple of weeks of February, setting the stage for the positivity that is normal in March and April, leading to the peak of the best six month period for stocks that began in October. A conservative stance to equity positioning in the near-term appears prudent, while intermediate term the weakness is likely to lend to renewed buying opportunities.
Today, in our Market Outlook to subscribers, we discuss the following:
- Hints of buying exhaustion in major market ETFs
- Out of the winners and into the laggards?
- US Banks
- Our weekly chart books update along with our list of all segments of the market to either Accumulate or Avoid
- Precious metals
Subscribers can look for this report in their inbox or by clicking on the following link and logging in: Market Outlook for February 21
Not signed up yet? Subscribe now to receive full access to all of the research and analysis that we publish.
Want to know which areas of the market to buy or sell? Our Weekly Chart Books have just been updated, providing a clear Accumulate, Avoid, or Neutral rating for currencies, cryptocurrencies, commodities, broad markets, and subsectors/industries of the market. Subscribers can login and click on the relevant links to access.
- Currencies
- Cryptocurrencies
- Commodities
- Major Benchmarks
- Sub-sectors / Industries
- ETFs: Bonds | Commodities | Equity Markets | Industries | Sectors
Subscribe now.
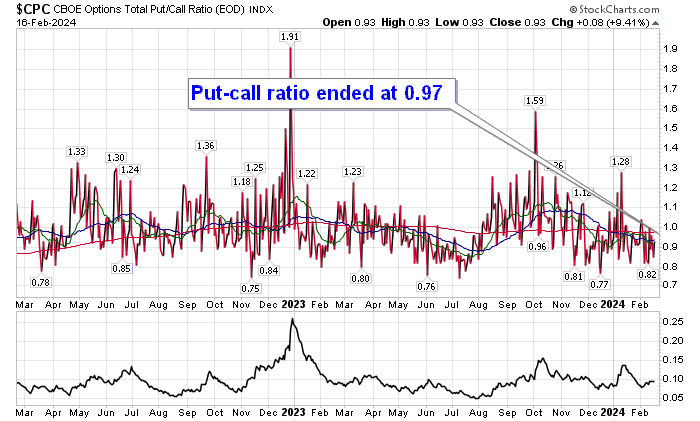
Sentiment on Tuesday, as gauged by the put-call ratio, ended close to neutral at 0.97.
Seasonal charts of companies reporting earnings today:


 Seasonal Chart")


S&P 500 Index
TSE Composite
| Sponsored By... |

|


