Stock Market Outlook for February 29, 2024

While a near-term pullback in the equity market remains probable, breadth indicators are in positions to suggest sustained strength over the intermediate-term (months).
*** Stocks highlighted are for information purposes only and should not be considered as advice to purchase or to sell mentioned securities. As always, the use of technical and fundamental analysis is encouraged in order to fine tune entry and exit points to average seasonal trends.
Stocks Entering Period of Seasonal Strength Today:
Subscribers Click on the relevant link to view the full profile. Not a subscriber? Signup here.

Avalonbay Communities, Inc. (NYSE:AVB) Seasonal Chart

Quest Diagnostics Inc. (NYSE:DGX) Seasonal Chart

Crown Castle Intl Corp. (NYSE:CCI) Seasonal Chart
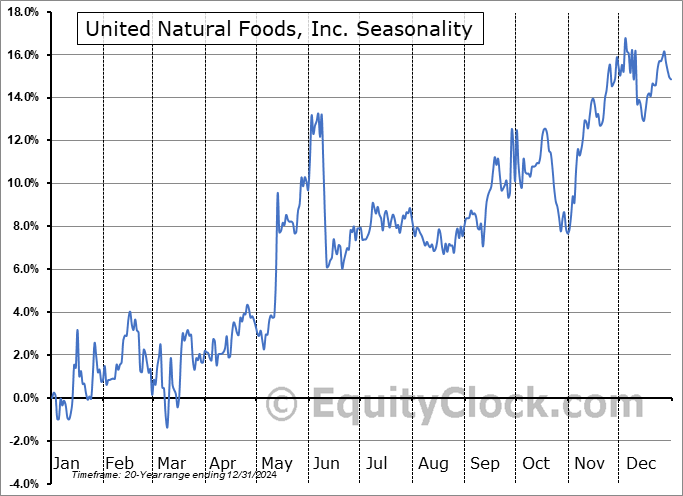
United Natural Foods, Inc. (NYSE:UNFI) Seasonal Chart

CSG Systems Intl, Inc. (NASD:CSGS) Seasonal Chart
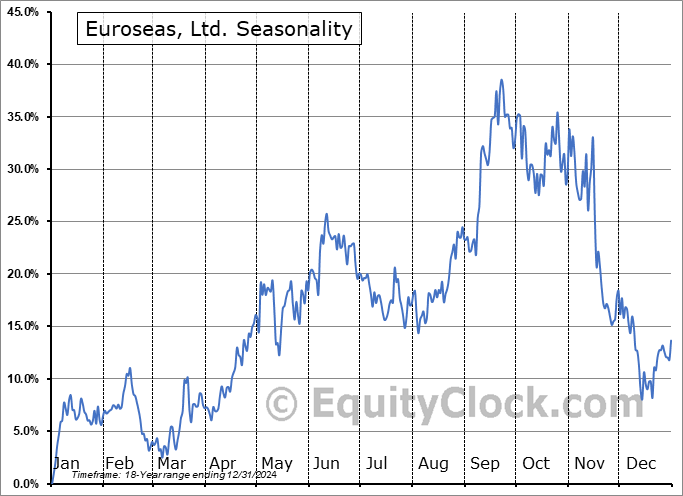
Euroseas, Ltd. (NASD:ESEA) Seasonal Chart

Trilogy Metals Inc. (AMEX:TMQ) Seasonal Chart

Invesco DWA Utilities Momentum ETF (NASD:PUI) Seasonal Chart
The Markets
Stocks drifted mildly lower on Wednesday as the digestion of recent market strength in growth segments (technology and communication services) becomes apparent in the charts. The S&P 500 Index closed lower by just less than two-tenths of one percent, still holding above the upside gap that was charted following the NVIDIA surge between 4983 and 5038. The zone aligns with the rising 20-day moving average, which is now just bordering on the psychologically important 5000 level, providing a key point of support to the short-term trend below. Major moving averages continue to expand above one another and momentum indicators are holding levels above their middle lines, both characteristics of a bullish trend. But while everything continues to look great for the intermediate (multi-month) trend of the market, negative divergences with respect to MACD and RSI continue to highlight waning buying demand, conducive to fuelling a near-term pullback before the first quarter is complete. The benchmark has managed to get through the weaker months of January and February unscathed, but the typical digestion of end of year strength may have just been delayed until portfolio managers execute their end of quarter trades in order to right-size positions back to investment policy guidelines. Our concern in our seasonal approach is what is in store for the intermediate-term path, therefore, while we have rotated to a position in our Super Simple Seasonal Portfolio that sells upside calls (a strategy that makes a lot of sense at this stage in the market in order to buffer against the potential of a near-term pullback), there are no signals to suggest any change required to the size of our equity allocation as we enter the tail-end to the best six months of the year for stocks that runs from the end of October through to the start of May.

Today, in our Market Outlook to subscribers, we discuss the following:
- Breadth indicators showing characteristics of a bullish trend
- Margin debt held in investor accounts
- Commitment of Traders (COT) report highlights growing pessimism among money managers
- Active Investment Manager Exposure to stocks
- The concerning trends of shipping volumes and expenditures
- The Dow Jones Transportation Average and what to Accumulate and what to Avoid in the transportation sector
Subscribers can look for this report in their inbox or by clicking on the following link and logging in: Market Outlook for February 29
Not signed up yet? Subscribe now to receive full access to all of the research and analysis that we publish.
Sentiment on Wednesday, as gauged by the put-call ratio, ended slightly bullish at 0.87.

Seasonal charts of companies reporting earnings today:

 Seasonal Chart")


 Seasonal Chart")


S&P 500 Index


TSE Composite


| Sponsored By... |

|


