Stock Market Outlook for March 18, 2024

Back-to-back weekly indecision candlesticks on the chart of the S&P 500 Index continues to highlight upside exhaustion.
*** Stocks highlighted are for information purposes only and should not be considered as advice to purchase or to sell mentioned securities. As always, the use of technical and fundamental analysis is encouraged in order to fine tune entry and exit points to average seasonal trends.
Stocks Entering Period of Seasonal Strength Today:
Subscribers Click on the relevant link to view the full profile. Not a subscriber? Signup here.

Talos Energy, Inc. (NYSE:TALO) Seasonal Chart

Invesco S&P 500 GARP ETF (AMEX:SPGP) Seasonal Chart

Invesco DWA Developed Markets Momentum ETF (NASD:PIZ) Seasonal Chart

Global X MLP & Energy Infrastructure ETF (AMEX:MLPX) Seasonal Chart

ALPS Equal Sector Weight ETF (NYSE:EQL) Seasonal Chart

PepsiCo, Inc. (NASD:PEP) Seasonal Chart

Shake Shack Inc. (NYSE:SHAK) Seasonal Chart

Permianville Royalty Trust (NYSE:PVL) Seasonal Chart
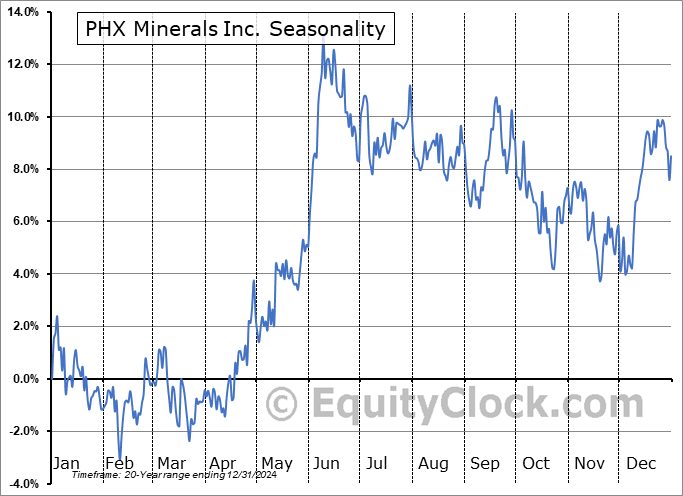
PHX Minerals Inc. (NYSE:PHX) Seasonal Chart

Crescent Point Energy Corp. (NYSE:CPG) Seasonal Chart

Targa Resources Corp. (NYSE:TRGP) Seasonal Chart

MEG Energy Corp. (TSE:MEG.TO) Seasonal Chart

DISH Network Corp. (NASD:DISH) Seasonal Chart

Invesco S&P Emerging Markets Momentum ETF (AMEX:EEMO) Seasonal Chart

Shell Plc (NYSE:SHEL) Seasonal Chart

Global X SuperDividend Alternatives ETF (NASD:ALTY) Seasonal Chart

Constellation Brands, Inc. (NYSE:STZ) Seasonal Chart

TransAlta Corp. (NYSE:TAC) Seasonal Chart
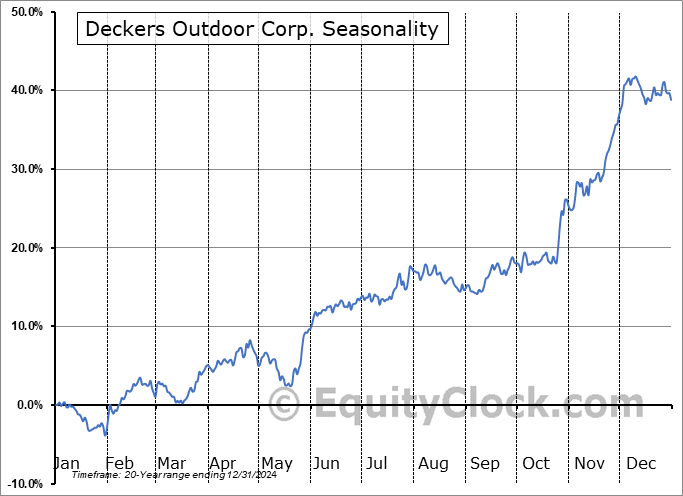
Deckers Outdoor Corp. (NYSE:DECK) Seasonal Chart

ConocoPhillips (NYSE:COP) Seasonal Chart

Laboratory Corporation of America Holdings (NYSE:LH) Seasonal Chart

Williams Cos., Inc. (NYSE:WMB) Seasonal Chart

ONEX Corp. (TSE:ONEX.TO) Seasonal Chart

CI Financial Corp. (TSE:CIX.TO) Seasonal Chart

American Fncl Group, Inc. (NYSE:AFG) Seasonal Chart

Ritchie Bros Auctioneers (NYSE:RBA) Seasonal Chart

Diageo PLC (NYSE:DEO) Seasonal Chart

Caesars Entertainment, Inc. (NASD:CZR) Seasonal Chart

BRP Inc. (NASD:DOOO) Seasonal Chart

Restaurant Brands International Inc. (NYSE:QSR) Seasonal Chart

iShares U.S. Preferred Stock ETF (NASD:PFF) Seasonal Chart
The Markets
Stocks closed lower on Friday as the momentum in the formerly hot technology trade loses its glow. The S&P 500 Index closed lower by two-thirds of one percent, pulling back to short-term support at the 20-day moving average (5095). A distinct rollover of Stochastics, RSI, and MACD from overbought territory can be seen as these momentum indicators continue to diverge from the direction of price, a sign of upside exhaustion. An ultra-short-term double top can be picked out on the chart of the large-cap benchmark just below 5200, a setup that would project a downside move to 5010 should support at 5095 become violated. The digestion of recent strength that is now playing out is expected to persist through the next week and a half as portfolio managers re-balance their books ahead of the end of the first quarter. Strength in the final hours of the quarter amidst portfolio window dressing and fund inflows through the month of April are slated to re-impose buying demand shortly, ideally following a rest and reset of the upward trajectory in the days ahead.

Today, in our Market Outlook to subscribers, we discuss the following:
- Weekly look at the large-cap benchmark
- US Industrial Production
- What the trend of Industrial Production has to say about who will win the presidential election this November
- Manufacturer sentiment
Subscribers can look for this report in their inbox or by clicking on the following link and logging in: Market Outlook for March 18
Not signed up yet? Subscribe now to receive full access to all of the research and analysis that we publish.
Sentiment on Friday, as gauged by the put-call ratio, ended bullish at 0.81.

Seasonal charts of companies reporting earnings today:


S&P 500 Index


TSE Composite


| Sponsored By... |

|

