Stock Market Outlook for March 22, 2024

Portfolio managers are not enthusiastic about these market heights, something that is expressed by the decline in the Dark Index over the past couple of quarters. However, this is actually a positive for the rising path of stocks.
*** Stocks highlighted are for information purposes only and should not be considered as advice to purchase or to sell mentioned securities. As always, the use of technical and fundamental analysis is encouraged in order to fine tune entry and exit points to average seasonal trends.
Stocks Entering Period of Seasonal Strength Today:
Subscribers Click on the relevant link to view the full profile. Not a subscriber? Signup here.

Wabtec (NYSE:WAB) Seasonal Chart

HealthStream, Inc. (NASD:HSTM) Seasonal Chart

BMO Equal Weight U.S. Health Care Hedged to CAD Index ETF (TSE:ZUH.TO) Seasonal Chart
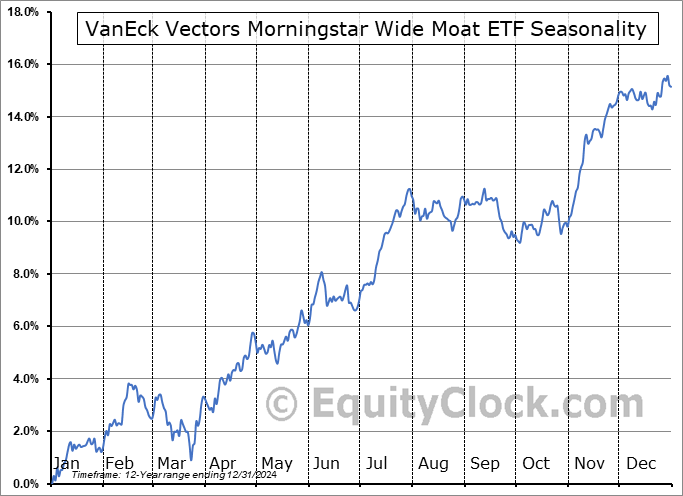
VanEck Vectors Morningstar Wide Moat ETF (AMEX:MOAT) Seasonal Chart

Primo Water Corporation (TSE:PRMW.TO) Seasonal Chart
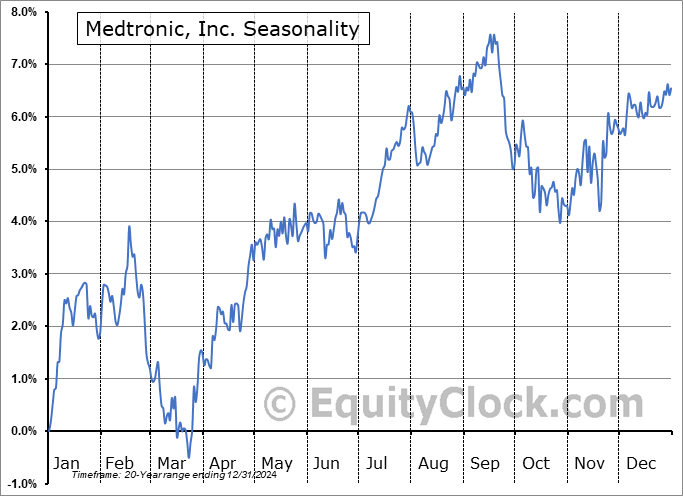
Medtronic, Inc. (NYSE:MDT) Seasonal Chart

Marathon Oil (NYSE:MRO) Seasonal Chart

Magna International Inc. (NYSE:MGA) Seasonal Chart

NRG Energy Inc. (NYSE:NRG) Seasonal Chart

Oneok, Inc. (NYSE:OKE) Seasonal Chart

AES Corp. (NYSE:AES) Seasonal Chart

American Homes 4 Rent (NYSE:AMH) Seasonal Chart

Independence Realty Trust, Inc. (NYSE:IRT) Seasonal Chart
The Markets
Stocks charted a fresh set of record highs, despite the downfall of the largest component in most market benchmarks, Apple (AAPL). The S&P 500 Index closed higher by just less than a third of one percent, continuing to reach higher from short-term support at the rising 20-day moving average (5132). The benchmark can be seen reaching up to the upper limit of its short-term rising range that has persisted year-to-date in a pattern that resembles a grind or reluctant buying as traders invest according to the trend rather than valuations. There is a clear lack of enthusiasm in this rally, something that is evident by the ongoing negative divergence of momentum indicators versus price. The lack of enthusiasm is actually a good thing for the rising path of stocks as it suggests that investors are aware of the risks and may not be excessively positioned to the extent that it would make the market vulnerable to a pronounced and, perhaps, sustained decline. Put-call ratios have persistently shown neutral readings around 1.00, certainly not the complacent readings that we would normally observe around significant market peaks. With the positivity that surrounds the month of April directly around the corner, there is a prospect of seeing the trend become parabolic and advance beyond the grind that has been observed previous, something that would start to provide the signs of excess to become concerned over.

Today, in our Market Outlook to subscribers, we discuss the following:
- Dark pool buying activity is reiterating the lack of enthusiasm towards stocks at these heights
- US Existing Home Sales
- Weekly Jobless Claims
- Philadelphia Fed Manufacturing Index
Subscribers can look for this report in their inbox or by clicking on the following link and logging in: Market Outlook for March 22
Not signed up yet? Subscribe now to receive full access to all of the research and analysis that we publish.
Sentiment on Thursday, as gauged by the put-call ratio, ended neutral at 0.98.

Seasonal charts of companies reporting earnings today:


S&P 500 Index


TSE Composite


| Sponsored By... |

|

