Stock Market Outlook for April 8, 2024

Economic data is increasingly favouring commodity exposure in portfolios.
*** Stocks highlighted are for information purposes only and should not be considered as advice to purchase or to sell mentioned securities. As always, the use of technical and fundamental analysis is encouraged in order to fine tune entry and exit points to average seasonal trends.
Stocks Entering Period of Seasonal Strength Today:
Subscribers Click on the relevant link to view the full profile. Not a subscriber? Signup here.

Summit Materials Inc. (NYSE:SUM) Seasonal Chart
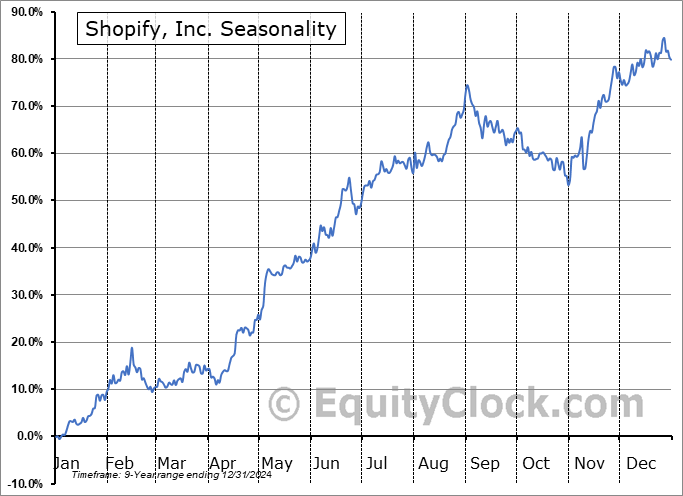
Shopify, Inc. (NYSE:SHOP) Seasonal Chart

Helen of Troy Ltd. (NASD:HELE) Seasonal Chart
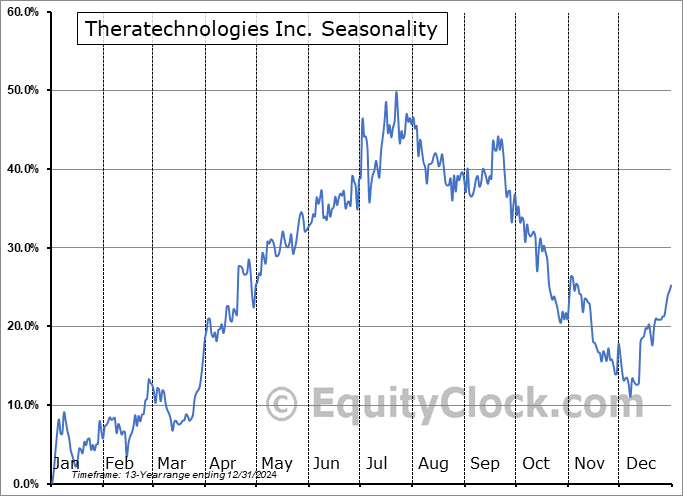
Theratechnologies Inc. (NASD:THTX) Seasonal Chart

Angie’s List Inc. (NASD:ANGI) Seasonal Chart

Ship Finance Intl Ltd. (NYSE:SFL) Seasonal Chart

HSBC Holdings PLC (NYSE:HSBC) Seasonal Chart

World Acceptance Corp. (NASD:WRLD) Seasonal Chart

Newpark Resources, Inc. (NYSE:NR) Seasonal Chart

Suburban Propane Partners LP (NYSE:SPH) Seasonal Chart

iShares MSCI Japan Small-Cap ETF (NYSE:SCJ) Seasonal Chart

Yeti Holdings Inc. (NYSE:YETI) Seasonal Chart
The Markets
Stocks snapped back to close the week as traders embraced a stronger than expected read of payroll growth for the month of March. The S&P 500 Index closed with a gain of 1.11%, retaking levels back above the 20-day moving average that was broken as a level of short-term support in the prior session. After months of fairly quiet/subdued trading action as stocks ground higher, perhaps reluctantly, volatility has returned, something that could be setting up for a significant peak as we get into the off-season for the equity market that starts in May. For now, characteristics of a bullish intermediate-term trend persist with moving averages advancing above one another and momentum indicators holding above their middle lines, warranting a positive view of the equity market at least through the remainder of April.

Today, in our Market Outlook to subscribers, we discuss the following:
- Weekly look at the large-cap benchmark
- US Employment Situation and the investment implications within
- Canada Labour Force Survey and what the results say about the fundamental drivers of the economy
- Investor Sentiment
Subscribers can look for this report in their inbox or by clicking on the following link and logging in: Market Outlook for April 8
Not signed up yet? Subscribe now to receive full access to all of the research and analysis that we publish.
Sentiment on Friday, as gauged by the put-call ratio, ended overly bearish at 1.21.

Seasonal charts of companies reporting earnings today:
- No significant earnings scheduled for today.
S&P 500 Index


TSE Composite


| Sponsored By... |

|

