Stock Market Outlook for April 30, 2024

Chinese equities are perking up and this bodes well for the trade in Emerging Markets.
*** Stocks highlighted are for information purposes only and should not be considered as advice to purchase or to sell mentioned securities. As always, the use of technical and fundamental analysis is encouraged in order to fine tune entry and exit points to average seasonal trends.
Stocks Entering Period of Seasonal Strength Today:
Subscribers Click on the relevant link to view the full profile. Not a subscriber? Signup here.
USANA Health Sciences, Inc. (NYSE:USNA) Seasonal Chart
Steris plc (NYSE:STE) Seasonal Chart
Prothena Corp. (NASD:PRTA) Seasonal Chart
Alibaba Group Holding Ltd. (NYSE:BABA) Seasonal Chart
A10 Networks, Inc. (NYSE:ATEN) Seasonal Chart
Vanguard S&P 500 Growth ETF (NYSE:VOOG) Seasonal Chart
The Markets
Stocks closed higher to start the week as traders prepare for the release of earnings reports slated to be released in the days ahead and brace for the FOMC meeting announcement on Wednesday. The S&P 500 Index closed with a gain of around a third of one percent, continuing to move higher from support at the 100-day moving average and pressuring resistance at the 20-day moving moving average at 5109. MACD is on the verge of producing a bullish cross of its signal line following the downfall that resulted from April’s market pullback, but risks remain that this momentum indicator (and others) are no longer on the bullish path that they once were coming into the normally upbeat month of April. Should this rebound in the large-cap benchmark merely prove to be a dead-cat bounce, the 5140 zone is a likely candidate where the stall to the near-term trend will be realized. Scrutinize the price action accordingly. The best six month timeframe for stocks concludes this week and it is set to close this seasonally strong period with one of the strongest performances in decades. As for how stocks perform through the following six months, we could get further insight on that very shortly if the rebound from last week’s low does in fact stall, thereby hinting of the shift of the rising trajectory of stocks and lending itself to a more conservative stance in equity market positioning.
Want to know which areas of the market to buy or sell? Our Weekly Chart Books have just been updated, providing a clear Accumulate, Avoid, or Neutral rating for currencies, cryptocurrencies, commodities, broad markets, and subsectors/industries of the market. Subscribers can login and click on the relevant links to access.
- Currencies
- Cryptocurrencies
- Commodities
- Major Benchmarks
- Sub-sectors / Industries
- ETFs: Bonds | Commodities | Equity Markets | Industries | Sectors
Subscribe now.
Today, in our Market Outlook to subscribers, we discuss the following:
- Our weekly chart books update, along with our list of all segments of the market to either Accumulate or Avoid
- Low Volatility ETF
- Mining stocks
Subscribers can look for this report in their inbox or by clicking on the following link and logging in: Market Outlook for April 30
Not signed up yet? Subscribe now to receive full access to all of the research and analysis that we publish.
Soon to be released…
We are busy placing the finishing touches on our Monthly report for May, providing you with the insight of everything to expect and themes to position for through the month(s) ahead. Subscribers can lookout for this extensive monthly report in their inbox in the days ahead.
Not signed up yet? Subscribe now to be included on our distribution list and receive all of the reports that we publish.
Sentiment on Monday, as gauged by the put-call ratio, ended slightly bullish at 0.93.
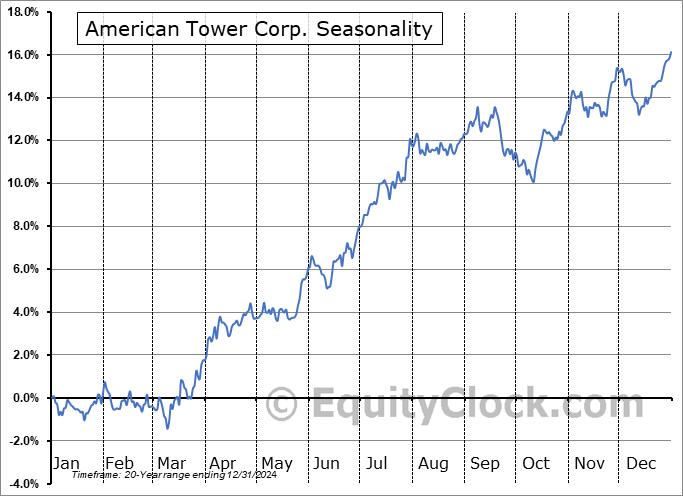
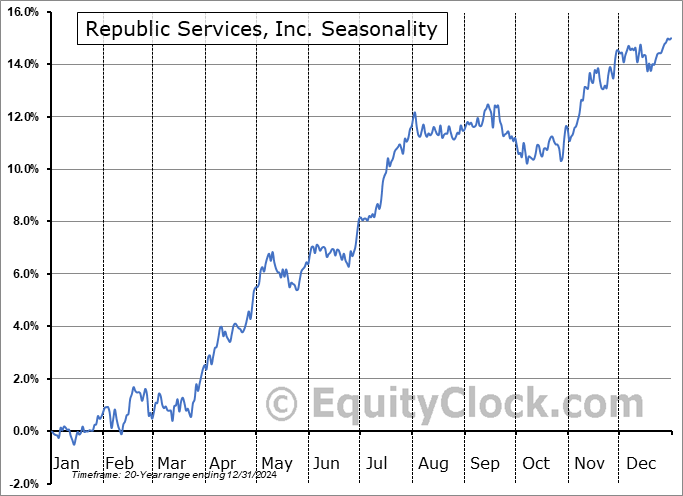
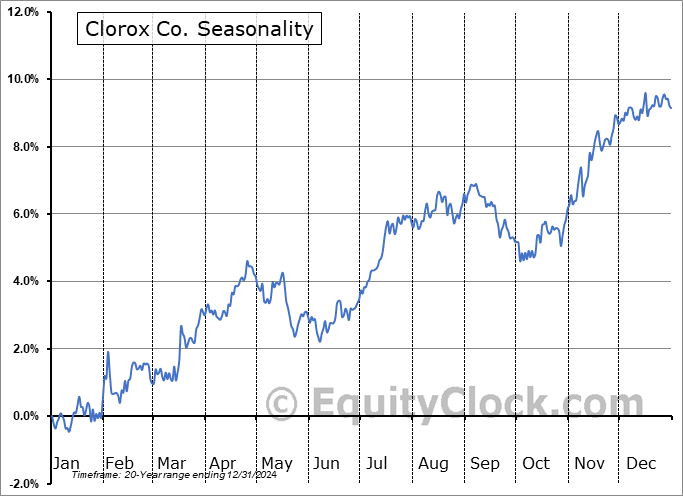
Seasonal charts of companies reporting earnings today:
S&P 500 Index
TSE Composite
| Sponsored By... |

|


