Stock Market Outlook for May 1, 2024

May tends to be a lack-lustre month, performance-wise, for stocks with the S&P 500 Index averaging a gain of a mere 0.2% over the past two decades.
*** Stocks highlighted are for information purposes only and should not be considered as advice to purchase or to sell mentioned securities. As always, the use of technical and fundamental analysis is encouraged in order to fine tune entry and exit points to average seasonal trends.
Stocks Entering Period of Seasonal Strength Today:
Subscribers Click on the relevant link to view the full profile. Not a subscriber? Signup here.

Hon Industries, Inc. (NYSE:HNI) Seasonal Chart

Digi Intl Inc. (NASD:DGII) Seasonal Chart
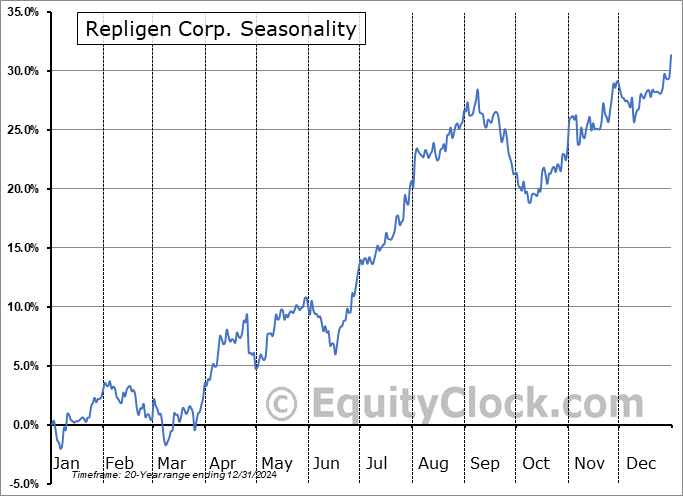
Repligen Corp. (NASD:RGEN) Seasonal Chart

Vista Outdoor Inc. (NYSE:VSTO) Seasonal Chart

Compx Intl, Inc. (AMEX:CIX) Seasonal Chart

Intellia Therapeutics, Inc. (NASD:NTLA) Seasonal Chart

Nuveen ESG Mid-Cap Growth ETF (AMEX:NUMG) Seasonal Chart
The Markets
Stocks closed firmly lower in the final session of April as renewed inflation concerns drove up the cost of borrowing and fuelled a selloff in the equity market. The S&P 500 Index closed down by 1.57%, turning lower from the confluence of resistance at the 20 and 50-day moving averages around 5120. Support continues to underpin the market at the 100-day moving average (4970), but Tuesday’s session provides the first significant clue that the benchmark may no longer be on a path where levels of support outweigh levels of resistance. The adoption of a short to intermediate-term declining trend is the risk and the rollover of the Relative Strength Index (RSI) below its middle line starts the process of adopting characteristics of a bearish path. It is always difficult to use the final session of the month as indication of the overall trend ahead given the tendency of portfolio manages to window dress/right size allocations, but the progression of the bounce from last week’s low at the 100-day moving average is certainly enough to elevate concerns that the pullback in stocks has further room to run on the downside. Intermediate-term risks are down to the breakout range between 4600 and 4800, a target that was not expected to be achieved until further into the off-season for stocks that starts next week, but Tuesday’s prices action suggest that we need to be cognizant of this downside potential now. Traditionally, the first few days of May are positive for stocks, but with headlines risks remaining high, it would be foolish to hook our wagon to normal patterns while headwinds against stocks are growing. Through the next six months, a more conservative stance to portfolio positioning has been appropriate and the market is providing some strong indications that this may be a prudent strategy this year.

Today, in our Market Outlook to subscribers, we discuss the following:
- Most sectors of the market are showing rejection from 20-day moving averages
- Monthly look at the S&P 500 Index
- Tendencies for stocks in May
- Securities that have gained or lost in every May over their trading history
- Case-Shiller Home Price Index
- Canada Gross Domestic Product (GDP)
Subscribers can look for this report in their inbox or by clicking on the following link and logging in: Market Outlook for May 1
Not signed up yet? Subscribe now to receive full access to all of the research and analysis that we publish.
For the month ahead, based on the past two decades, May tends to be a lacklustre month, performance wise, as the off-season for stocks gets underway. Over the past 20 years, the S&P 500 Index has gained a mere 0.2%, on average, in the fifth month of the year, but the frequency of positive results is still impressive at 75% of periods. Results have ranged from a decline of 8.2% in May of 2010 to a gain of 5.3% in May of 2009. We break down everything that were are looking for in our just released monthly report for May.


Just released…
Our monthly report for May is out, providing you with everything you need to know to navigate the market through the month(s) ahead.
Highlights in this report include:
- Equity market tendencies in the month of May
- Sell In May and Go Away trade and the historical performance of the strategy
- Defense or Offense: Industry groups that provide the best of both worlds during the summer
- Looking for an opportunity in India
- Time to overweight bonds?
- Gold
- Dollar, Yields, and Stocks
- Net Assets held by the Fed
- Consumer Price Index (CPI)
- Retail Sales
- Rising Retailer Inventories
- Consumer loan activity reminiscent of past recessions
- Credit card loans continue to trend above average
- Visa Spending Momentum Index in contraction
- Consumer Discretionary sector within a long-term trend of underperformance
- Abnormal March Declines in Business Loans and Shipping Activity
- Copper
- Short-term pain for long-term gain
- Defensive Tilt in the Market Emerging
- Our list of all segments of the market to either Accumulate or Avoid, along with relevant ETFs
- Positioning for the months ahead
- Sector Reviews and Ratings
- Stocks that have Frequently Gained in the Month of May
- Notable Stocks and ETFs Entering their Period of Strength in May
Subscribers can look for this 109-page report in their inbox and, soon, in the report archive.
Not subscribed yet? Signup now to receive access to this report and all of the research that we publish.
With the new month upon us and as we celebrate the release of our monthly report for May, today we release our screen of all of the stocks that have gained in every May over their trading history. While we at Equity Clock focus on a three-pronged approach (seasonal, technical, and fundamental analysis) to gain exposure to areas of the market that typically perform well over intermediate (2 to 6 months) timeframes, we know that stocks that have a 100% frequency of success for a particular month is generally of interest to those pursuing a seasonal investment strategy. Below are the results:

And how about those securities that have never gained in this fifth month of the year, here they are:

*Note: None of the results highlighted above have the 20 years of data that we like to see in order to accurately gauge the annual recurring, seasonal influences impacting an investment, therefore the reliability of the results should be questioned. We present the above list as an example of how our downloadable spreadsheet available to yearly subscribers can be filtered.
Sentiment on Tuesday, as gauged by the put-call ratio, ended bullish at 0.88.

Seasonal charts of companies reporting earnings today:


 Seasonal Chart")


 Seasonal Chart")


S&P 500 Index


TSE Composite


| Sponsored By... |

|

