Stock Market Outlook for May 3, 2024

Emerging market equities are moving beyond their sideways range that they have been stuck in for the past two years.
*** Stocks highlighted are for information purposes only and should not be considered as advice to purchase or to sell mentioned securities. As always, the use of technical and fundamental analysis is encouraged in order to fine tune entry and exit points to average seasonal trends.
Stocks Entering Period of Seasonal Strength Today:
Subscribers Click on the relevant link to view the full profile. Not a subscriber? Signup here.

Owens & Minor Inc. Holding Co. (NYSE:OMI) Seasonal Chart

Golar LNG Ltd (NASD:GLNG) Seasonal Chart

Seagen (NASD:SGEN) Seasonal Chart
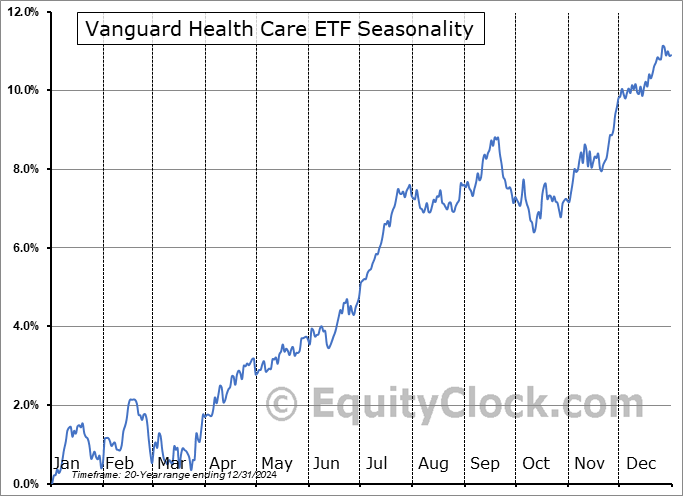
Vanguard Health Care ETF (NYSE:VHT) Seasonal Chart

Match Group, Inc (NASD:MTCH) Seasonal Chart

Medpace Holdings, Inc. (NASD:MEDP) Seasonal Chart

TransDigm Group Inc. (NYSE:TDG) Seasonal Chart

Royal Gold, Inc. (NASD:RGLD) Seasonal Chart

CHS Inc. (NASD:CHSCP) Seasonal Chart

Invesco Dynamic Large Cap Growth ETF (NYSE:PWB) Seasonal Chart

ADT Inc (NYSE:ADT) Seasonal Chart
The Markets
Stocks gained in the Thursday session as traders continued to find relief in the fact that the Fed was not as hawkish as feared following its 2-day FOMC meeting on Wednesday. The S&P 500 Index closed with a gain of nine-tenths of one percent, ending within close vicinity of resistance at the 20-day moving average (5087). Ahead of an uncertain event, which jobs report Friday offers, this is essentially a neutral position, giving traders optionality to position around the event. The chart portrays a short-term trend that remains in decline with the intermediate-term trend under threat as we near the traditional time of year to consider rotating away from some of the seasonal bets that have worked well over the past six months. Support remains firm at the 100-day moving average (4979), but, with characteristics of a bearish trend starting to emerge now that momentum indicators have adopted positions below their middle lines, there are certainly questions as to how long it can hold, particularly if the rebound we are in the midst of stalls below the highs set in March. Until evidence shows otherwise, the benchmark remains on an intermediate-term path of higher-highs and higher-lows, which is enough to maintain a positive bias of equities according to our seasonal approach, but it is certainly on our mind as to when it may be prudent to rein in equity market risk in portfolios.

Today, in our Market Outlook to subscribers, we discuss the following:
- Breakout of emerging markets
- Weekly jobless claims and the health of the labor market
- A look ahead to April’s Non-Farm Payroll report
- Natural Gas
- US Vehicle Sales
Subscribers can look for this report in their inbox or by clicking on the following link and logging in: Market Outlook for May 3
Not signed up yet? Subscribe now to receive full access to all of the research and analysis that we publish.
Sentiment on Thursday, as gauged by the put-call ratio, ended neutral at 0.98.

Seasonal charts of companies reporting earnings today:
 Seasonal Chart")


S&P 500 Index


TSE Composite


| Sponsored By... |

|

