Stock Market Outlook for May 6, 2024

While Technology attracted all of the attention on Friday, it was Utilities that came out the winner on the week, highlighting a defensive tilt that is becoming embedded in trading activity.
*** Stocks highlighted are for information purposes only and should not be considered as advice to purchase or to sell mentioned securities. As always, the use of technical and fundamental analysis is encouraged in order to fine tune entry and exit points to average seasonal trends.
Stocks Entering Period of Seasonal Strength Today:
Subscribers Click on the relevant link to view the full profile. Not a subscriber? Signup here.

Murphy Oil Corp. Holding Co. (NYSE:MUR) Seasonal Chart
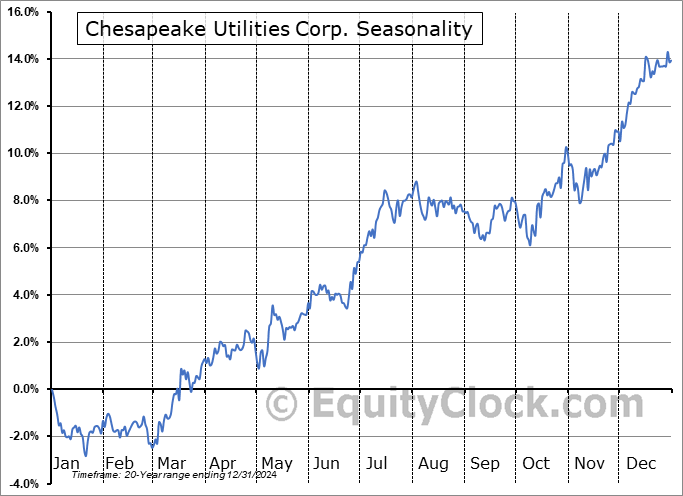
Chesapeake Utilities Corp. (NYSE:CPK) Seasonal Chart

Orrstown Financial Services Inc. (NASD:ORRF) Seasonal Chart

Fox Factory Holding Corp. (NASD:FOXF) Seasonal Chart

Barings BDC, Inc. (NYSE:BBDC) Seasonal Chart

Pacer Trendpilot 100 ETF (NASD:PTNQ) Seasonal Chart

Centerspace (NYSE:CSR) Seasonal Chart

Apyx Medical Corp. (NASD:APYX) Seasonal Chart

Twilio Inc. (NYSE:TWLO) Seasonal Chart

Invesco DWA Technology Momentum ETF (NASD:PTF) Seasonal Chart

iShares MSCI USA Momentum Factor ETF (AMEX:MTUM) Seasonal Chart

Paylocity Holding Corp. (NASD:PCTY) Seasonal Chart

Mullen Group Ltd. (TSE:MTL.TO) Seasonal Chart

Meta Financial Group, Inc. (NASD:CASH) Seasonal Chart

Live Nation Entertainment, Inc. (NYSE:LYV) Seasonal Chart

WD-40 Co. (NASD:WDFC) Seasonal Chart
The Markets
Stocks rallied to close the week following a weaker than expected read of employment for April and a strong reaction to earnings from tech-titan Apple. The S&P 500 Index closed higher by 1.26%, moving above short-term resistance at the 20-day moving average and reaching back towards its 50-day moving average at 5130. Support remains firm at the 100-day moving average (4984), working to keep the rising intermediate-term path of stocks alive. An upside gap charted at Friday’s open between 5073 and 5101 creates another level below that the market will seek to shoot off of in their long-side bias. The gain on the day was sufficient to trigger a MACD buy signal as the momentum indicator advances back above its signal line. Similarly, the Relative Strength Index (RSI) can be seen moving into the upper half of its range as an attempt is made to mitigate the adoption of a bearish path that the technical indicator was threatening to produce just a few days ago. The level of the benchmark is now hovering around the level (5140) that we suggested to scrutinize for signs of near-term upside exhaustion before starting to make any implications as to the health of the intermediate-term trend of the benchmark. So far there is nothing to indicate that the intermediate (multi-month) path has broken stride in order to warrant peeling back on risk (equity) exposure in portfolios, but further scrutiny is required through the days ahead as the off-season for stocks begins. The first week of May marks the average peak to the best six month timeframe for stocks and the S&P 500 Index has rallied by 24.5% during this period, representing the sixth best performance for this timeframe in the past five decades. While returns for the risk-off period between now and the end of October are typically lacklustre by comparison, they are not normally negative, nor do they frequently produce a loss, leaving plenty of opportunities to position both bullishly and bearishly during the notoriously volatile summer trade. Refer to our list of Accumulate and Avoid candidates for areas of the market that are setup well to buy or to sell.

Today, in our Market Outlook to subscribers, we discuss the following:
- Weekly look at the large-cap benchmark
- Market continuing to express a defensive tilt
- Aggregate Bond market
- US Employment Situation, including the investment implications within the results
Subscribers can look for this report in their inbox or by clicking on the following link and logging in: Market Outlook for May 6
Not signed up yet? Subscribe now to receive full access to all of the research and analysis that we publish.
Sentiment on Friday, as gauged by the put-call ratio, ended neutral at 0.95.

Seasonal charts of companies reporting earnings today:


 Seasonal Chart")


S&P 500 Index


TSE Composite


| Sponsored By... |

|

