Stock Market Outlook for May 7, 2024

The bond market is stabilizing around significant levels of support, providing a positive setup for stocks and bonds heading into the period of seasonal strength for the fixed income asset class.
*** Stocks highlighted are for information purposes only and should not be considered as advice to purchase or to sell mentioned securities. As always, the use of technical and fundamental analysis is encouraged in order to fine tune entry and exit points to average seasonal trends.
Stocks Entering Period of Seasonal Strength Today:
Subscribers Click on the relevant link to view the full profile. Not a subscriber? Signup here.
Veeva Systems Inc. (NYSE:VEEV) Seasonal Chart
Zscaler, Inc. (NASD:ZS) Seasonal Chart
Protagonist Therapeutics, Inc. (NASD:PTGX) Seasonal Chart
Jewett-Cameron Trading Co. (NASD:JCTCF) Seasonal Chart
C&F Financial Corp. (NASD:CFFI) Seasonal Chart
IAMGold Corp. (TSE:IMG.TO) Seasonal Chart
Bel Fuse, Inc. (NASD:BELFB) Seasonal Chart
Middlesex Water Co. (NASD:MSEX) Seasonal Chart
InterActiveCorp (NASD:IAC) Seasonal Chart
Aspen Technology, Inc. (NASD:AZPN) Seasonal Chart
S.Y. Bancorp, Inc. (NASD:SYBT) Seasonal Chart
National Health Invs, Inc. (NYSE:NHI) Seasonal Chart
Southwest Gas Corp. (NYSE:SWX) Seasonal Chart
The Markets
Stocks rallied to start the week as traders found comfort from the stabilization in the bond market following last month’s selloff. The S&P 500 Index closed with a gain of just over one percent, moving back above resistance at the 50-day moving average. The move completes a short-term bottoming pattern around 4950 and projects a target of the previous high charted at the end of March around 5250. The rising 100-day moving average remains in a position to support the intermediate-term rising trend, keeping stocks on a positive slope heading into the weaker half of the year that is now upon us. The pattern of the benchmark over a multi-month time frame remains that of higher-highs and higher-lows, warranting a positive view of stocks according to our seasonal approach. At some point in the next six months, we expect that a full-blown correction of 10% or more will be realized, but while levels of intermediate-term support continue to have greater strength than levels of intermediate-term resistance, reason for a positive bias of risk assets persists., something that our list of market segments to Accumulate emphasizes quite nicely.
Want to know which areas of the market to buy or sell? Our Weekly Chart Books have just been updated, providing a clear Accumulate, Avoid, or Neutral rating for currencies, cryptocurrencies, commodities, broad markets, and subsectors/industries of the market. Subscribers can login and click on the relevant links to access.
- Currencies
- Cryptocurrencies
- Commodities
- Major Benchmarks
- Sub-sectors / Industries
- ETFs: Bonds | Commodities | Equity Markets | Industries | Sectors
Subscribe now.
Today, in our Market Outlook to subscribers, we discuss the following:
- Our Weekly Chart Books update, along with our list of all segments of the market to either Accumulate or Avoid
- Treasury bond market stabilizing around levels of significant support
- US Dollar Index
- Investor sentiment
Subscribers can look for this report in their inbox or by clicking on the following link and logging in: Market Outlook for May 7
Not signed up yet? Subscribe now to receive full access to all of the research and analysis that we publish.
Sentiment on Monday, as gauged by the put-call ratio, ended overly bearish at 1.31.
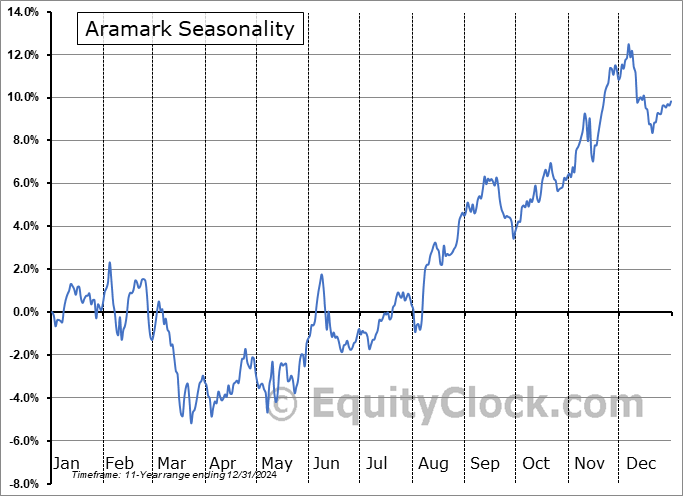
Seasonal charts of companies reporting earnings today:
S&P 500 Index
TSE Composite
| Sponsored By... |

|


