Stock Market Outlook for May 8, 2024

While tendencies for stocks during Election years calls for strength between the end of May and the middle of August, the actual performance of the equity market this year has contradicted what is normal for these years.
*** Stocks highlighted are for information purposes only and should not be considered as advice to purchase or to sell mentioned securities. As always, the use of technical and fundamental analysis is encouraged in order to fine tune entry and exit points to average seasonal trends.
Stocks Entering Period of Seasonal Strength Today:
Subscribers Click on the relevant link to view the full profile. Not a subscriber? Signup here.

iShares Core US Growth ETF (NASD:IUSG) Seasonal Chart

Asensus Surgical, Inc. (AMEX:ASXC) Seasonal Chart

TOMI Environmental Solutions, Inc. (NASD:TOMZ) Seasonal Chart

Vanguard Long-Term Government Bond ETF (NASD:VGLT) Seasonal Chart

iShares 20+ Year Treasury Bond ETF (NASD:TLT) Seasonal Chart

SPDR Barclays Long Term Treasury ETF (AMEX:SPTL) Seasonal Chart

Invesco Dynamic Biotechnology & Genome ETF (NYSE:PBE) Seasonal Chart

iShares Russell 1000 Growth ETF (NYSE:IWF) Seasonal Chart

Factset Research Sys, Inc. (NYSE:FDS) Seasonal Chart

Qualys, Inc. (NASD:QLYS) Seasonal Chart

Crawford & Co. (NYSE:CRD/A) Seasonal Chart

CTS Corp. (NYSE:CTS) Seasonal Chart
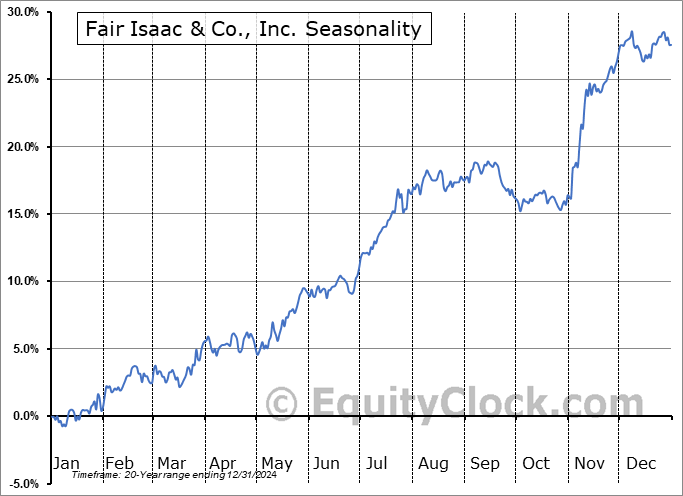
Fair Isaac & Co., Inc. (NYSE:FICO) Seasonal Chart

Salesforce.com, Inc. (NYSE:CRM) Seasonal Chart
The Markets
Stocks closed mixed on Tuesday amidst a slight drift lower in the cost of borrowing as traders attempt to keep the upside momentum in stocks going. The S&P 500 Index closed with a gain of just over a tenth of one percent, holding above both the 20 and 50-day moving averages that have been retaken as levels of support in recent days. The 100-day moving average at 4995 continues to underpin the rising intermediate-term trend of higher-highs and higher-lows on the benchmark, warranting an ongoing bullish bias of stocks, for now, as we progress into this off-season for risk assets. The next level of resistance to the upside is, quite obviously, the end of March/start of April highs around 5260, a level that the bulls will be seeking a definitive break of which to confirm that the positive trajectory of the benchmark is still intact.

Today, in our Market Outlook to subscribers, we discuss the following:
- Election year tendencies for stocks
- The start of the optimal holding period for long-term treasury bonds and our preferred bets in the bond market
- Trend of bonds relative to stocks
- Commitment of Traders (COT) allocation to bonds
- The surge in agriculture commodity prices in recent weeks
Subscribers can look for this report in their inbox or by clicking on the following link and logging in: Market Outlook for May 8
Not signed up yet? Subscribe now to receive full access to all of the research and analysis that we publish.
Sentiment on Tuesday, as gauged by the put-call ratio, ended neutral at 1.00.

Seasonal charts of companies reporting earnings today:


S&P 500 Index


TSE Composite


| Sponsored By... |

|


