Stock Market Outlook for May 13, 2024

Resource employment in Canada has realized unprecedented growth through the first four months of this year, providing a fundamental nod to commodity related investments heading through the spring.
*** Stocks highlighted are for information purposes only and should not be considered as advice to purchase or to sell mentioned securities. As always, the use of technical and fundamental analysis is encouraged in order to fine tune entry and exit points to average seasonal trends.
Stocks Entering Period of Seasonal Strength Today:
Subscribers Click on the relevant link to view the full profile. Not a subscriber? Signup here.

Twist Bioscience Corp. (NASD:TWST) Seasonal Chart

Schwab 1000 Index ETF (AMEX:SCHK) Seasonal Chart

AI Powered Equity ETF (AMEX:AIEQ) Seasonal Chart

Global X FinTech Thematic ETF (NASD:FINX) Seasonal Chart

Sunrun Inc. (NASD:RUN) Seasonal Chart

SPDR S&P 1500 Momentum Tilt ETF (AMEX:MMTM) Seasonal Chart

iShares Exponential Technologies ETF (NASD:XT) Seasonal Chart

Vanguard U.S. Total Market Index ETF (CAD-hedged) (TSE:VUS.TO) Seasonal Chart
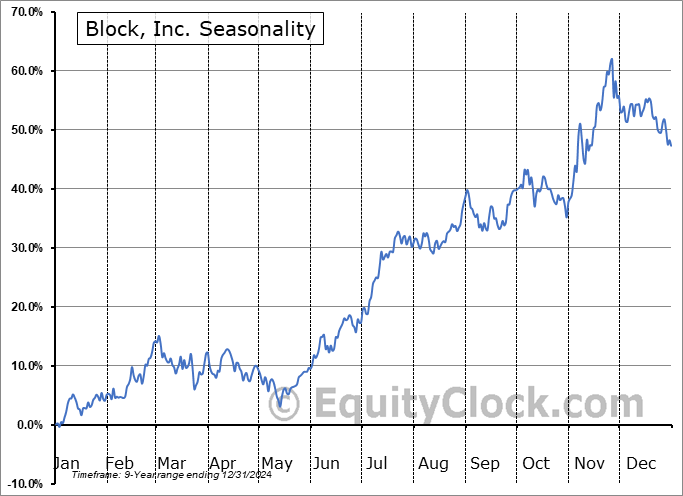
Block, Inc. (NYSE:SQ) Seasonal Chart

Teladoc Health, Inc. (NYSE:TDOC) Seasonal Chart

Global Water Resources Inc. (NASD:GWRS) Seasonal Chart

Amplify Online Retail ETF (AMEX:IBUY) Seasonal Chart

Stericycle, Inc. (NASD:SRCL) Seasonal Chart

Boardwalk Equities, Inc. (TSE:BEI/UN.TO) Seasonal Chart

Simon Property Group, Inc. (NYSE:SPG) Seasonal Chart
The Markets
Stocks had a mixed showing on Friday as interest rates moved higher following the release of a much stronger than expected employment report in Canada. The S&P 500 Index closed with a gain of nearly two-tenths of one percent, continuing to inch back toward the all-time high around 5260. Support remains firm at the 100-day moving average (5010), a hurdle that is working to support the rising intermediate-term path of stocks and keeping us with a bullish bias of stocks as we head into this off-season for the asset class. Momentum indicators continue to move above the mid-points to their spans with the Relative Strength Index (RSI) now seen reaching towards declining trendline resistance that had been signalling waning buying demand in the market over the past few months. The intermediate-term chart pattern continues to reveal that levels of support continue to have greater significance than levels of resistance, keeping traders on the ready to buy the dips as part of this upward progression in the market that started in October of 2022.

Today, in our Market Outlook to subscribers, we discuss the following:
- Weekly look at the large-cap benchmark
- The breakout of the Consumer Staples sector and the upside target the move suggests
- Majority of market sectors holding levels of rising intermediate support
- Canada Labour Force Survey and the investment implications within
- The ongoing surge in Canada’s population
- The path of the Canadian Dollar within its period of seasonal strength
Subscribers can look for this report in their inbox or by clicking on the following link and logging in: Market Outlook for May 13
Not signed up yet? Subscribe now to receive full access to all of the research and analysis that we publish.
Sentiment on Friday, as gauged by the put-call ratio, ended close to neutral at 0.93.

Seasonal charts of companies reporting earnings today:


S&P 500 Index


TSE Composite


| Sponsored By... |

|


