Stock Market Outlook for May 14, 2024

While a defensive shift in the market has emerged, stocks are not showing the characteristics that would traditionally precede a pullback/correction.
*** Stocks highlighted are for information purposes only and should not be considered as advice to purchase or to sell mentioned securities. As always, the use of technical and fundamental analysis is encouraged in order to fine tune entry and exit points to average seasonal trends.
Stocks Entering Period of Seasonal Strength Today:
Subscribers Click on the relevant link to view the full profile. Not a subscriber? Signup here.

Catalent, Inc. (NYSE:CTLT) Seasonal Chart

Vanguard ESG US Stock ETF (AMEX:ESGV) Seasonal Chart

Cohen & Steers Select Preferred & Income Fund Inc. (NYSE:PSF) Seasonal Chart

Invesco India ETF (NYSE:PIN) Seasonal Chart

Invesco DWA SmallCap Momentum ETF (NASD:DWAS) Seasonal Chart

Accenture Ltd. (NYSE:ACN) Seasonal Chart

Yelp Inc. (NYSE:YELP) Seasonal Chart

Universal Display Corp. (NASD:OLED) Seasonal Chart
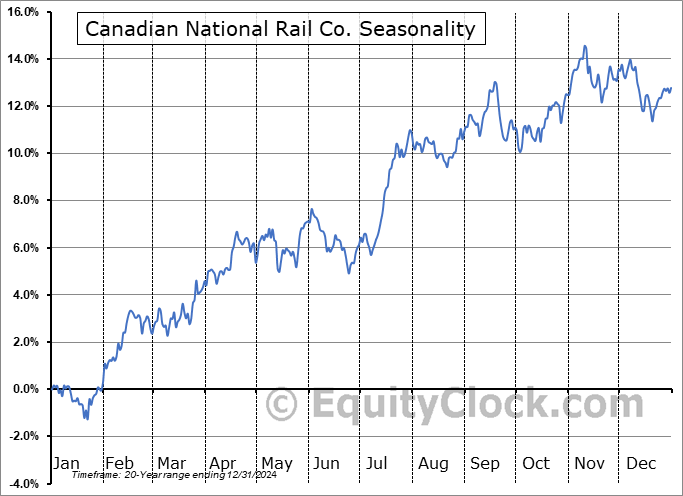
Canadian National Rail Co. (NYSE:CNI) Seasonal Chart

Independent Bank Corp. (NASD:INDB) Seasonal Chart

MSCI, Inc. (NYSE:MSCI) Seasonal Chart

Perrigo Co. (NYSE:PRGO) Seasonal Chart
The Markets
Stocks closed mixed to start the week as traders brace for a couple of key inflation reports slated to be released in the days ahead. The S&P 500 Index ended down by a mere two basis points (0.02%), sitting just slightly below the all-time high that was charted in March around 5264. Support at the 100-day moving average (5015) continues to underpin the rising intermediate-term path of the benchmark as the previous peak is threatened heading further into this off-season for stocks that began after the first week of May. Momentum indicators continue to make progress above their middle lines, managing to stave off the adoption of characteristics of a bearish trend. Ultimately, this is still a market that is showing greater support than resistance, warranting a bullish bias of stocks until this pattern changes. Seasonal tendencies for stocks tend to be a little soft over the next week or so, but the Memorial Day holiday bump is rapidly approaching, a tendency that gives lift to stocks surrounding the long weekend and into the start of June.

Want to know which areas of the market to buy or sell? Our Weekly Chart Books have just been updated, providing a clear Accumulate, Avoid, or Neutral rating for currencies, cryptocurrencies, commodities, broad markets, and subsectors/industries of the market. Subscribers can login and click on the relevant links to access.
- Currencies
- Cryptocurrencies
- Commodities
- Major Benchmarks
- Sub-sectors / Industries
- ETFs: Bonds | Commodities | Equity Markets | Industries | Sectors
Subscribe now.
Today, in our Market Outlook to subscribers, we discuss the following:
- Our weekly chart books update, along with our list of all segments of the market to either Accumulate or Avoid
- The gravitation towards defensive, higher-yielding segments of the market
- Number of net new highs on the NYSE not yet showing characteristics of a bearish path developing for stocks
Subscribers can look for this report in their inbox or by clicking on the following link and logging in: Market Outlook for May 14
Not signed up yet? Subscribe now to receive full access to all of the research and analysis that we publish.
Sentiment on Monday, as gauged by the put-call ratio, ended slightly bullish at 0.91.

Seasonal charts of companies reporting earnings today:
 Seasonal Chart")


S&P 500 Index


TSE Composite


| Sponsored By... |

|


