Stock Market Outlook for May 15, 2024

The return of the meme-stock craze has started to create some euphoria in the market, which is certainly not a bad thing, yet.
*** Stocks highlighted are for information purposes only and should not be considered as advice to purchase or to sell mentioned securities. As always, the use of technical and fundamental analysis is encouraged in order to fine tune entry and exit points to average seasonal trends.
Stocks Entering Period of Seasonal Strength Today:
Subscribers Click on the relevant link to view the full profile. Not a subscriber? Signup here.

Principal Quality ETF (NASD:PSET) Seasonal Chart

PrimeEnergy Resources Corp. (NASD:PNRG) Seasonal Chart

NOV Inc (NYSE:NOV) Seasonal Chart
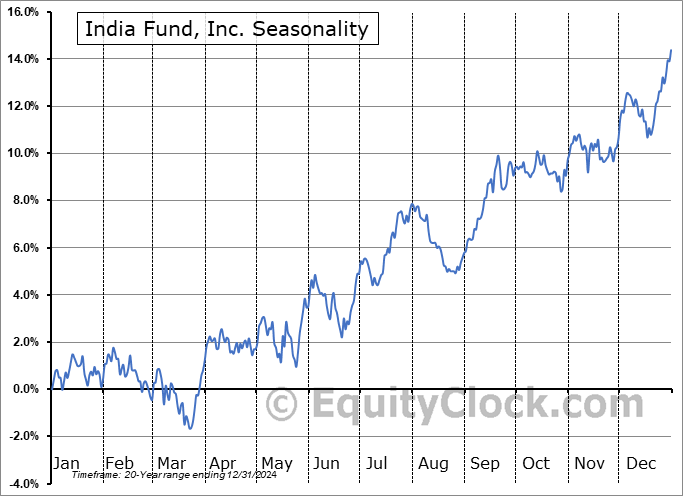
India Fund, Inc. (NYSE:IFN) Seasonal Chart

City Office REIT, Inc. (NYSE:CIO) Seasonal Chart

Enviva Inc. (NYSE:EVA) Seasonal Chart

Applied Optoelectronics Inc. (NASD:AAOI) Seasonal Chart

MagnaChip Semiconductor Corp. (NYSE:MX) Seasonal Chart
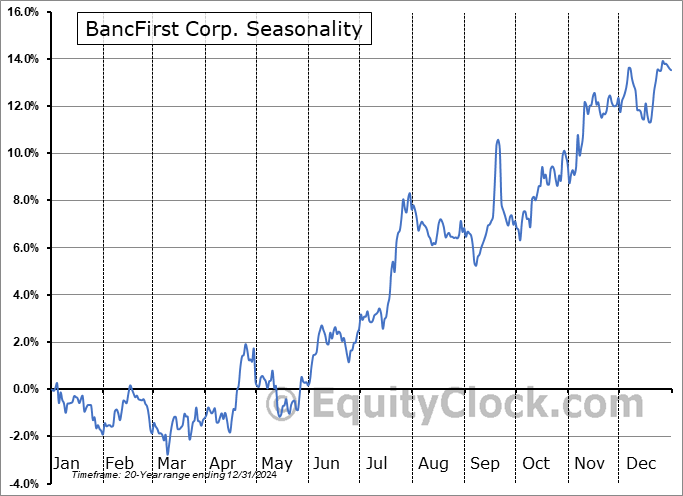
BancFirst Corp. (NASD:BANF) Seasonal Chart

Boston Beer Co. Cl A (NYSE:SAM) Seasonal Chart
The Markets
Stocks rallied on Tuesday as traders shook off of a hotter than expected read of inflationary pressures for April and focused on the rebirth of the meme-stock craze. The S&P 500 Index added around half of one percent, knocking on the door of the all-time high that was charted at the end of March around 5264. The rising intermediate-term trend of the benchmark remains well intact, supported by the 100-day moving average, now at 5020. The 20-day moving average is back on the rise, adding a positive bias back to the short-term trend of stocks as we progress further into the off-season for this asset class that began just over a week ago. Until this market shows greater evidence of resistance than support, reason to maintain a bullish bias of stocks exists. particularly in those groups that we have been advocating to Accumulate in our weekly chart books (see our list of market segments to Accumulate or to Avoid).

Today, in our Market Outlook to subscribers, we discuss the following:
- The return of the meme-stock craze, creating some euphoria in the market, and how we are benefiting in our list of Accumulate candidates
- Producer Price Index (PPI), what is driving inflationary pressures, and how to play the themes that are proliferating in the producer economy
- Commodities and inflation hedges
- Shipping Volumes/Demand and the trade to play this fundamental backdrop
Subscribers can look for this report in their inbox or by clicking on the following link and logging in: Market Outlook for May 15
Not signed up yet? Subscribe now to receive full access to all of the research and analysis that we publish.
Sentiment on Tuesday, as gauged by the put-call ratio, ended slightly bullish at 0.89.

Seasonal charts of companies reporting earnings today:

 Inc. Seasonal Chart")


S&P 500 Index


TSE Composite


| Sponsored By... |

|


