Stock Market Outlook for April 16, 2024

The breakout of the short-term treasury bond ETF is suggesting that the consolidation phase that the bond market has been in this year has come to an end.
*** Stocks highlighted are for information purposes only and should not be considered as advice to purchase or to sell mentioned securities. As always, the use of technical and fundamental analysis is encouraged in order to fine tune entry and exit points to average seasonal trends.
Stocks Entering Period of Seasonal Strength Today:
Subscribers Click on the relevant link to view the full profile. Not a subscriber? Signup here.

Sensus Healthcare, Inc. (NASD:SRTS) Seasonal Chart

ETFMG Prime Mobile Payments ETF (AMEX:IPAY) Seasonal Chart

Global X Millennials Thematic ETF (NASD:MILN) Seasonal Chart

Via Renewables, Inc. (NASD:VIASP) Seasonal Chart

EcoSynthetix Inc. (TSE:ECO.TO) Seasonal Chart

Alamos Gold Inc. (TSE:AGI.TO) Seasonal Chart

Invesco S&P 500 Pure Growth ETF (NYSE:RPG) Seasonal Chart

Wix.com Ltd. (NASD:WIX) Seasonal Chart

Vicor Corp. (NASD:VICR) Seasonal Chart

Colliers International Group Inc. (NASD:CIGI) Seasonal Chart
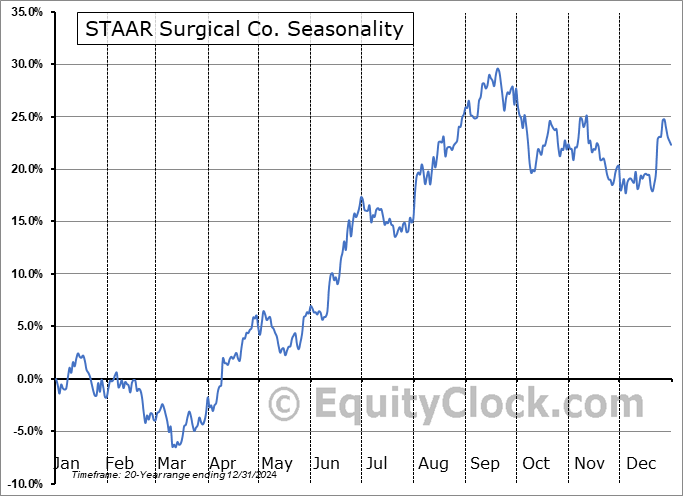
STAAR Surgical Co. (NASD:STAA) Seasonal Chart

TTEC Holdings, Inc. (NASD:TTEC) Seasonal Chart

LivePerson, Inc. (NASD:LPSN) Seasonal Chart
The Markets
Stocks jumped on Wednesday following the release of a consumer price report for April that indicated inflationary pressures, on aggregate, were inline with expectations for the spring month. The S&P 500 Index closed higher by 1.17%, breaking out to a fresh record high as the previous peak charted in March at 5264 was taken out. Instantly, the indications of struggle that the benchmark suffered from through the month of April are being erased and now the benchmark is reaching back up to overbought territory, a characteristic of a bullish intermediate-term trend. The 100-day moving average (5026) remains the underpinning to the rising intermediate path of higher-highs and higher-lows and it appears that not even the off-season for stocks is going to stand in the way of that. Momentum indicators are back into the upper halves of their ranges and major moving averages are all back on a positive slope, presenting a bullish bias for stocks over multiple timeframes. Seasonally, the middle of May is typically a softer period for equity market performance now that earnings season is wrapped up, but with interest rates and the dollar providing a tailwind to prices, the path of least resistance for stocks is higher.

Today, in our Market Outlook to subscribers, we discuss the following:
- Dollar, Yields, and Stocks
- The segments of the bond market that are of most interest at present
- The break of the consolidation range in short-term treasury bond prices
- US Consumer Price Index (CPI) and tailoring portfolios towards those segments of the economy that are going to benefit amidst a more discerning consumer backdrop
- The rise in Airfare
- US Retail Sales and the investment implications within
Subscribers can look for this report in their inbox or by clicking on the following link and logging in: Market Outlook for May 16
Not signed up yet? Subscribe now to receive full access to all of the research and analysis that we publish.
Sentiment on Wednesday, as gauged by the put-call ratio, ended slightly bullish at 0.86.

Seasonal charts of companies reporting earnings today:


S&P 500 Index


TSE Composite


| Sponsored By... |

|


