Stock Market Outlook for May 24, 2024

An outside reversal candlestick on major equity benchmarks is threatening to produce a significant topping pattern.
*** Stocks highlighted are for information purposes only and should not be considered as advice to purchase or to sell mentioned securities. As always, the use of technical and fundamental analysis is encouraged in order to fine tune entry and exit points to average seasonal trends.
Stocks Entering Period of Seasonal Strength Today:
Subscribers Click on the relevant link to view the full profile. Not a subscriber? Signup here.

iShares Russell Top 200 Growth ETF (NYSE:IWY) Seasonal Chart

BAIYU Holdings, Inc. (NASD:BYU) Seasonal Chart

SPDR S&P 500 Fossil Fuel Free ETF (AMEX:SPYX) Seasonal Chart

Carvana Co. (NYSE:CVNA) Seasonal Chart

Enlivex Therapeutics Ltd. (NASD:ENLV) Seasonal Chart

SPDR Morgan Stanley Technology ETF (AMEX:XNTK) Seasonal Chart

iShares North American Tech ETF (NYSE:IGM) Seasonal Chart

BMO NASDAQ 100 Equity Hedged to CAD Index ETF (TSE:ZQQ.TO) Seasonal Chart

Boot Barn Holdings Inc. (NYSE:BOOT) Seasonal Chart

Dynavax Technologies Corp. (NASD:DVAX) Seasonal Chart
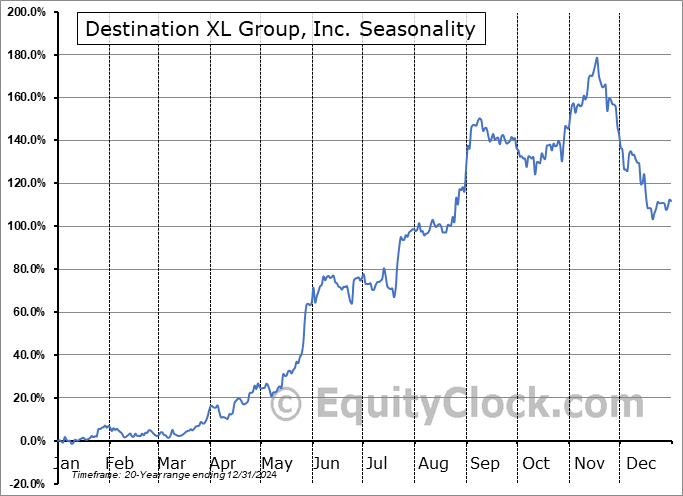
Destination XL Group, Inc. (NASD:DXLG) Seasonal Chart

Urban Outfitters, Inc. (NASD:URBN) Seasonal Chart

Iron Mountain, Inc. (NYSE:IRM) Seasonal Chart

Bancolombia SA (NYSE:CIB) Seasonal Chart
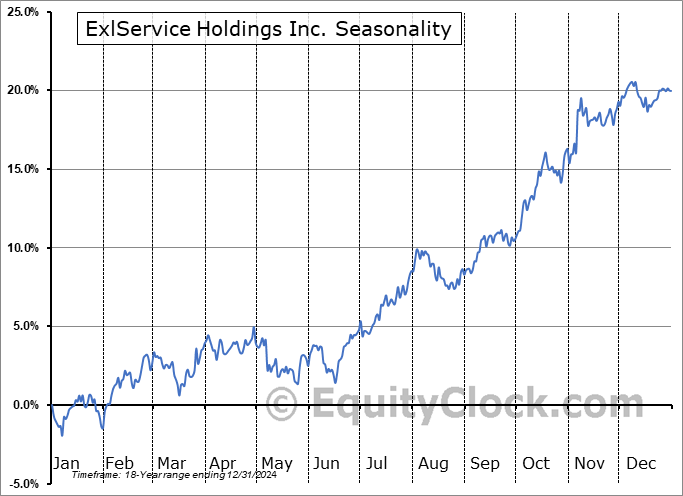
ExlService Holdings Inc. (NASD:EXLS) Seasonal Chart

Global X China Consumer ETF (NYSE:CHIQ) Seasonal Chart
The Markets
Stocks closed broadly lower on Thursday as a slight uptick in interest rates and the desire of traders to hold a neutral allocation to risk ahead of the long weekend had market participants hitting the sell button. The S&P 500 Index closed down by around three-quarters of one percent, charting an outside reversal candlestick on the day. The bearish setup is derived by an open above the prior session’s high followed by a close below the prior session’s low, effectively encompassing the previous day’s range. This is a mark of upside exhaustion and the fact that it is occurring just slightly above the previous peak in the market charted in March raises the risk of a significant intermediate-term topping pattern developing. Thursday’s move resolves a short-term consolidation span that developed in recent days between 5285 and 5325, projecting downside risks of the same magnitude of the prevailing range, or to 5245. Momentum indicators on the daily chart continue to roll over below their previous peaks, showing yet another divergence versus price that once again emphasizes waning buying demand and the lack of interest in committing new funds around these market peaks. MACD is threatening to reveal another sell signal in the days ahead should it cross back below its signal line. The price action that is playing out could easily deny the recent breakout move in this and other benchmarks (eg. Dow Jones Industrial Average, Small Caps, Mid-Caps), enticing traders to step back while upside momentum struggles. While seasonal tendencies typically support stocks around the Memorial Day holiday, this positivity may have been exhausted earlier in the month, providing the setup to see an earlier than normal start to the span of weakness that weighs on equity benchmarks through the month of June. The summer rally period for stocks is around a month away (around the end of June), leaving this timeframe in the interim where a sideways to lower drift is certainly reasonable, perhaps allowing for more favourable levels to buy stocks for the period of seasonal strength in a few weeks from now. Thursday’s price action and the risk aversion that has developed in recent days/weeks is providing compelling evidence that the market bulls are tired.

Today, in our Market Outlook to subscribers, we discuss the following:
- The Artificial Intelligence (AI) influence not having the same impact on broad equity market performance that it once had
- The change that we are making in the Super Simple Seasonal Portfolio
- The Sell signal produced by our simple 12-21 strategy using the VIX
- US New Home Sales and the topping pattern on homebuilding ETFs
- Consumer loan activity and the flip that is being realized away from credit card debt
- Weekly jobless claims and the health of the labor market
Subscribers can look for this report in their inbox or by clicking on the following link and logging in: Market Outlook for May 24
Not signed up yet? Subscribe now to receive full access to all of the research and analysis that we publish.
Sentiment on Thursday, as gauged by the put-call ratio, ended bullish at 0.84.

Seasonal charts of companies reporting earnings today:


S&P 500 Index


TSE Composite


| Sponsored By... |

|


