Stock Market Outlook for May 30, 2024

Traders can be seen alleviating the excesses that had built up in portfolios through the first quarter.
*** Stocks highlighted are for information purposes only and should not be considered as advice to purchase or to sell mentioned securities. As always, the use of technical and fundamental analysis is encouraged in order to fine tune entry and exit points to average seasonal trends.
Stocks Entering Period of Seasonal Strength Today:
Subscribers Click on the relevant link to view the full profile. Not a subscriber? Signup here.
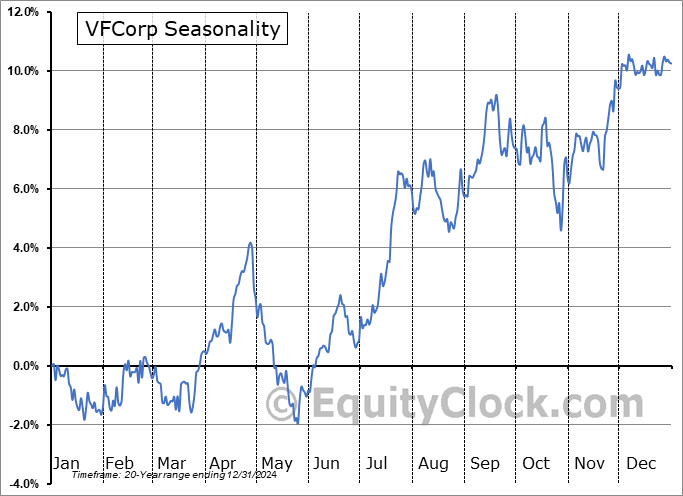
VFCorp (NYSE:VFC) Seasonal Chart

Laurentian Bank Of Canada (TSE:LB.TO) Seasonal Chart

National Retail Properties Inc. (NYSE:NNN) Seasonal Chart

OGE Energy Corp. (NYSE:OGE) Seasonal Chart

Wintrust Financial Corp. (NASD:WTFC) Seasonal Chart

MGE Energy, Inc. (NASD:MGEE) Seasonal Chart

ATRION Corp. (NASD:ATRI) Seasonal Chart

CECO Environmental Corp. (NASD:CECO) Seasonal Chart
The Markets
Stocks pulled back on Wednesday as topping patterns continue to develop across the charts, raising the risk of a more substantial pullback than the first half of April decline. The S&P 500 Index closed down by nearly three-quarters of one percent, moving back below the recent short-term trading range between 5285 and 5325. The initial downside target from the break of the 40-point range is to 5245, or to levels around the 20-day moving average. The threat of a more substantial double-top pattern across the charts, however, has downside implications beyond the April lows, possibly reaching as far as the 200-day moving average (4765). MACD is back touching its signal line, on the verge of charting a bearish crossover in the days ahead and reconfirming the negative divergence that momentum indicators have been portraying pertaining to waning buying demand around recent market heights. The technicals and seasonal patterns are all lining up negatively for stocks heading into the month of June, suggesting that traders should buckle up and refrain from being aggressive in stocks until this corrective phase is complete. The next opportunity to become buyers is around the end of June for the summer rally period that runs through the first few weeks of July.

Today, in our Market Outlook to subscribers, we discuss the following:
- Traders pushing into Mega-Cap Tech
- Double-top patterns becoming increasingly defined across the market
- Risk aversion is dominating market performance
- Investors pulling down margin debt that had been built up through the first quarter
- The strong rise of US Home Prices this year
Subscribers can look for this report in their inbox or by clicking on the following link and logging in: Market Outlook for May 30
Not signed up yet? Subscribe now to receive full access to all of the research and analysis that we publish.
Sentiment on Wednesday, as gauged by the put-call ratio, ended neutral at 0.99.

Seasonal charts of companies reporting earnings today:


 Seasonal Chart")


S&P 500 Index


TSE Composite


| Sponsored By... |

|


