Stock Market Outlook for July 18, 2024

A near-term retracement in the technology sector back towards levels of intermediate to long-term support may be underway.
*** Stocks highlighted are for information purposes only and should not be considered as advice to purchase or to sell mentioned securities. As always, the use of technical and fundamental analysis is encouraged in order to fine tune entry and exit points to average seasonal trends.
Stocks Entering Period of Seasonal Strength Today:
Subscribers Click on the relevant link to view the full profile. Not a subscriber? Signup here.

Green Plains Partners LP (NASD:GPP) Seasonal Chart

VanEck Vectors Retail ETF (NASD:RTH) Seasonal Chart

SPDR S&P Insurance ETF (NYSE:KIE) Seasonal Chart
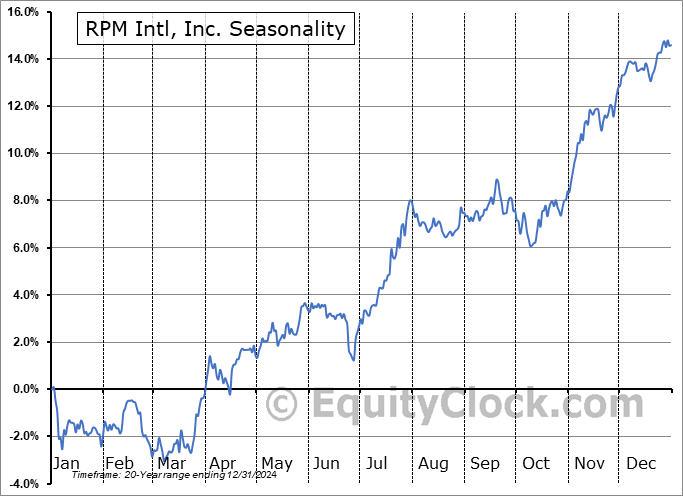
RPM Intl, Inc. (NYSE:RPM) Seasonal Chart

Trio-Tech Intl (AMEX:TRT) Seasonal Chart

West Bancorporation, Inc. (NASD:WTBA) Seasonal Chart

Xylem Inc. (NYSE:XYL) Seasonal Chart

Oxford Industries Inc. (NYSE:OXM) Seasonal Chart

Glacier Bancorp, Inc. (NYSE:GBCI) Seasonal Chart
The Markets
Stocks closed mixed on Wednesday as a sharp selloff in the Technology sector had investor hitting the sell button to the once hot growth trade. The S&P 500 Index ended lower by 1.39%, charting a downside open gap between 5622 and 5658 that will likely work to cap the the summer rally now that we have reached the average peak to. Support remains intact around major moving averages, which are fanning out positively and continuing to provide characteristics of a bullish trend. Wednesday’s abrupt downturn has pulled the Relative Strength Index (RSI) out of overbought territory to now sit at the lowest level in a month and a half, suggesting a near-term peak to this momentum indicator and providing a near-term signal to sell as we head towards the most volatile period on the calendar in August, September, and October. Even with the one-day downturn, the large-cap benchmark exits its summer rally period that started on June 27th higher by 2.01%, which is well above the average return for this approximately three-week timeframe of 1.29%. Time to start preparing portfolio strategy for the period of volatility for stocks that runs through the next three months.

Today, in our Market Outlook to subscribers, we discuss the following:
- The near-term U-turn in Technology
- The seasonal rotation from Semiconductor to Software stocks
- US Industrial Production and the investment implications within
- US Housing Starts and the stocks of the homebuilders
Subscribers can look for this report in their inbox or by clicking on the following link and logging in: Market Outlook for July 18
Not signed up yet? Subscribe now to receive full access to all of the research and analysis that we publish.
Sentiment on Wednesday, as gauged by the put-call ratio, ended bullish at 0.83.

Seasonal charts of companies reporting earnings today:


S&P 500 Index


TSE Composite


| Sponsored By... |

|


