Stock Market Outlook for July 25, 2024

An important gauge of risk sentiment is starting to shift out of the bullish trend that it has been in since 2022 as risk aversion grips the market.
*** Stocks highlighted are for information purposes only and should not be considered as advice to purchase or to sell mentioned securities. As always, the use of technical and fundamental analysis is encouraged in order to fine tune entry and exit points to average seasonal trends.
Stocks Entering Period of Seasonal Strength Today:
Subscribers Click on the relevant link to view the full profile. Not a subscriber? Signup here.
Triumph Financial, Inc. (NASD:TFIN) Seasonal Chart
Renovaro Biosciences Inc. (NASD:RENB) Seasonal Chart
Koppers Holdings Inc. (NYSE:KOP) Seasonal Chart
SKTelecom Co. Ltd. (NYSE:SKM) Seasonal Chart
Willdan Group Inc. (NASD:WLDN) Seasonal Chart
Tennant Co. (NYSE:TNC) Seasonal Chart
The Markets
Well if you needed proof that the market has entered into its period of seasonal volatility that follows the notorious summer rally period, you certainly got it on Wednesday. The S&P 500 Index closed down by 2.31%, intersecting with the 50-day moving average (5428) for the first time since the start of May. Another downside gap has been opened between 5508 and 5550, adding an additional layer of resistance below the gap that was charted on July 17th that capped the now past summer rally period. Near-term momentum remains negative as formerly beloved growth trades circle back towards levels of intermediate-term (multi-month) support. Heading into the end of July, it would not be surprising to see a reprieve in near-term downside pressures, but the period of volatility/weakness in the market is just beginning, something that tends to have a more significant influence in August, September, and October. Defensive assets and volatility hedges are certainly preferred at this time of year and amidst the present technical and fundamental backdrops. Both of our model portfolios have been positioned for the volatility that is now being realized and our list of market candidates to Accumulate is blanketed with securities that are positioned well to mitigate the erratic trading environment that is normal through the remainder of the third quarter.
Today, in our Market Outlook to subscribers, we discuss the following:
- Bond market breaking out of its trend of underperformance versus stocks
- The ratio of Consumer Staples versus Consumer Discretionary
- Rotation towards defensive sectors of Utilities and Health Care
- US New Home Sales and the stocks of the home builders
- The downfall of consumer loan activity and the gravitation consumers are showing toward home equity lines of credit
Subscribers can look for this report in their inbox or by clicking on the following link and logging in: Market Outlook for July 25
Not signed up yet? Subscribe now to receive full access to all of the research and analysis that we publish.
Sentiment on Wednesday, as gauged by the put-call ratio, ended bearish at 1.04.
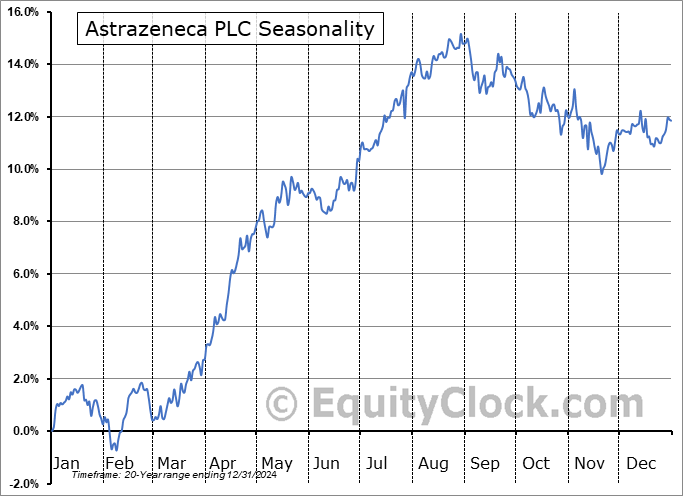
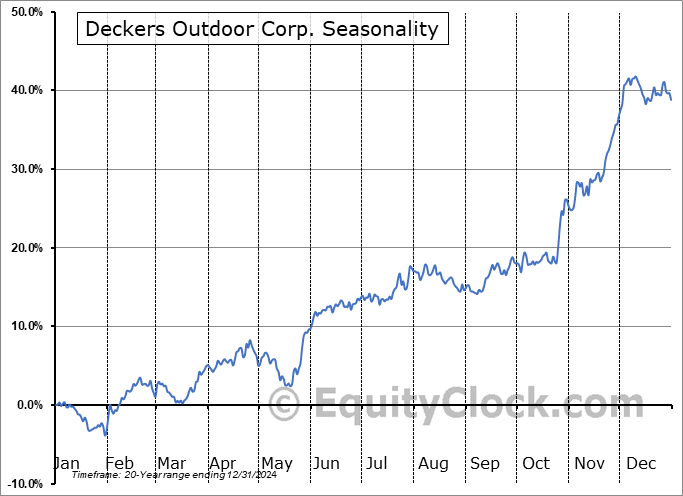
Seasonal charts of companies reporting earnings today:
S&P 500 Index
TSE Composite
| Sponsored By... |

|


