Stock Market Outlook for July 30, 2024

Major technology benchmarks are testing levels of rising intermediate-term levels of support, presenting the logical point to see a rebound attempted.
*** Stocks highlighted are for information purposes only and should not be considered as advice to purchase or to sell mentioned securities. As always, the use of technical and fundamental analysis is encouraged in order to fine tune entry and exit points to average seasonal trends.
Stocks Entering Period of Seasonal Strength Today:
Subscribers Click on the relevant link to view the full profile. Not a subscriber? Signup here.
iShares 1-3 Year Treasury Bond ETF (NASD:SHY) Seasonal Chart
Franklin FTSE India ETF (AMEX:FLIN) Seasonal Chart
Zymeworks Inc. (NASD:ZYME) Seasonal Chart
Titan Mining Corp. (TSE:TI.TO) Seasonal Chart
Gen Digital Inc. (NASD:GEN) Seasonal Chart
BMO India Equity Index ETF (TSE:ZID.TO) Seasonal Chart
Humana, Inc. (NYSE:HUM) Seasonal Chart
iShares India 50 ETF (NASD:INDY) Seasonal Chart
Tyler Technologies, Inc. (NYSE:TYL) Seasonal Chart
Old Republic Intl Corp. (NYSE:ORI) Seasonal Chart
Garmin Ltd. (NYSE:GRMN) Seasonal Chart
Waste Management, Inc. (NYSE:WM) Seasonal Chart
The Markets
Stocks closed mixed on Monday as investors wait for an onslaught of earnings in the days ahead, as well as the always scrutinized FOMC meeting mid-week. The S&P 500 Index closed with a gain of just less than a tenth of one percent, continuing to amount a slight bounce from levels around the 50-day moving average at 5439. Gap resistance remains overhead between 5508 and 5550, just one of multiple layers overhead that are in a position to cap the benchmark as we get further into the period of volatility for stocks in August, September, and October. The Relative Strength Index (RSI) sits slightly below the 50-line, placing the burden of proof on the bulls to reinvigorate upside momentum in the near-term or give up the ball to the bears amidst the knowledge that the months ahead are notoriously the weakest time of year for the equity market. Defensive assets and volatility hedges are certainly preferred at this time of year. At the start of the period of volatility for stocks, covered call strategies can be your friend to replicate benchmark holdings (eg. S&P 500 Index) and provide yield to portfolios, while buffering against the erratic trading. The optimal holding period of the Global X S&P 500 Covered Call ETF (XYLD) started yesterday (July 29th), a period that has historically produced an average return of around half of one percent above the S&P 500 Total Return Index through to the 18th of October, encompassing the period of volatility for stocks.
Want to know which areas of the market to buy or sell? Our Weekly Chart Books have just been updated, providing a clear Accumulate, Avoid, or Neutral rating for currencies, cryptocurrencies, commodities, broad markets, and subsectors/industries of the market. Subscribers can login and click on the relevant links to access.
- Currencies
- Cryptocurrencies
- Commodities
- Major Benchmarks
- Sub-sectors / Industries
- ETFs: Bonds | Commodities | Equity Markets | Industries | Sectors
Subscribe now.
Today, in our Market Outlook to subscribers, we discuss the following:
- Our weekly chart books update, along with our list of all market segments to either Accumulate or Avoid
- Our weekly chart books notes – NEW
- Oil moving below significant support at its 200-week moving average
- Copper testing a critical level of support
Subscribers can look for this report in their inbox or by clicking on the following link and logging in: Market Outlook for July 30
Not signed up yet? Subscribe now to receive full access to all of the research and analysis that we publish.
Sentiment on Monday, as gauged by the put-call ratio, ended bullish at 0.90.
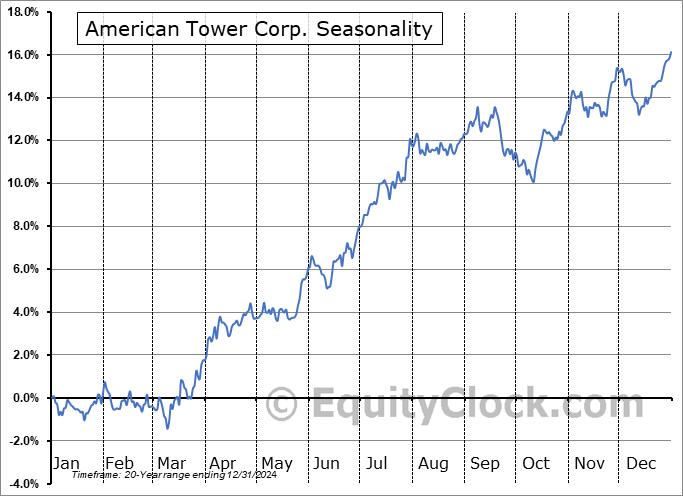
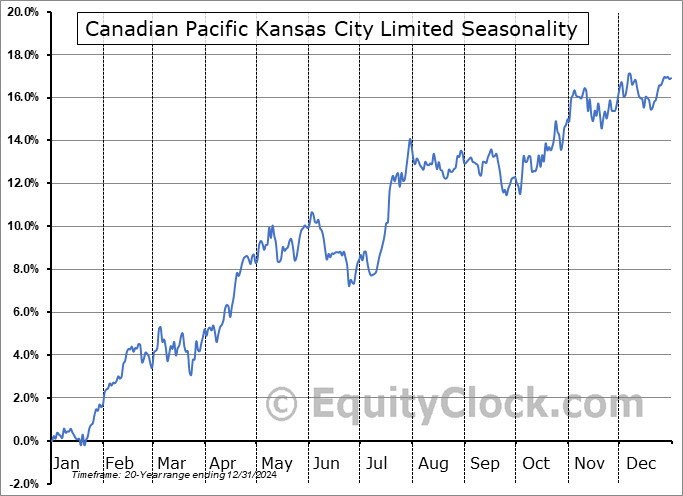
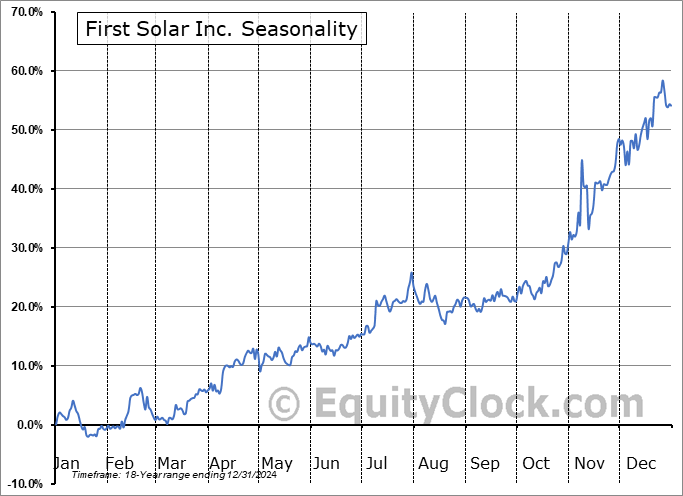
Seasonal charts of companies reporting earnings today:
S&P 500 Index
TSE Composite
| Sponsored By... |

|


