Stock Market Outlook for August 6, 2024

The period of volatility in the equity market is clearly here, requiring risk aversion and volatility hedges in portfolios for the months ahead.
*** Stocks highlighted are for information purposes only and should not be considered as advice to purchase or to sell mentioned securities. As always, the use of technical and fundamental analysis is encouraged in order to fine tune entry and exit points to average seasonal trends.
Stocks Entering Period of Seasonal Strength Today:
Subscribers Click on the relevant link to view the full profile. Not a subscriber? Signup here.
Innovative Industrial Properties, Inc. (NYSE:IIPR) Seasonal Chart
Loews Corp. (NYSE:L) Seasonal Chart
Norwegian Cruise Line Holdings Ltd. (NYSE:NCLH) Seasonal Chart
iShares Select Dividend ETF (NASD:DVY) Seasonal Chart
Designer Brands Inc. (NYSE:DBI) Seasonal Chart
Archer Daniels Midland Co. (NYSE:ADM) Seasonal Chart
PriceSmart, Inc. (NASD:PSMT) Seasonal Chart
Comtech Telecommunications Corp. (NASD:CMTL) Seasonal Chart
CME Group Inc. (NASD:CME) Seasonal Chart
Gibraltar Steel Corp. (NASD:ROCK) Seasonal Chart
Hilton Worldwide Holdings Inc. (NYSE:HLT) Seasonal Chart
IntercontinentalExchange Group, Inc. (NYSE:ICE) Seasonal Chart
Note: Monday is a stat holiday in Canada (Civic Holiday) and, as a result, our next Market Outlook report will be provided on Tuesday. Our weekly chart books will be updated on schedule on Sunday, but the commentary will be released when we get back to our desk on Tuesday. Enjoy the long weekend!
The Markets
Stocks sold off aggressively for a second day as economic data continues to reveal an abrupt economic slowdown that has many starting to price in the risk of recession. The S&P 500 Index closed with a loss of 1.84%, falling firmly below the 50-day moving average (5449) for the first time since April. Resistance at the 20-day moving average (5527) has been confirmed, defining and capping a negative trend over a short-term timescale. The 100-day moving average (5307) is now being tested as support, a variable hurdle that enticed buying demand back to the market following the April pullback. Momentum indicators are increasingly losing their characteristics of a bullish trend by falling below their middle lines and now the intermediate-term trend that we prioritize on in our seasonal work is under threat. The period of volatility for the equity market is clearly upon us and, while the short-term oversold readings may exhaust downside pressures in the near-term, traders should expect a weaker tape through the months ahead. As we have been emphasizing, defensive assets and volatility hedges are certainly preferred at this time of year, a call that has been prudent over the past couple of sessions. In our model portfolios, we have been positioned for this onset of volatility and have been embracing the appreciation in our defensive/risk-off holdings in recent weeks.
Today, in our Market Outlook to subscribers, we discuss the following:
- Weekly look at the large-cap benchmark
- An under the radar volatility hedge that is entering its optimal holding period
- US Employment Situation and the investment implications within
- US Factory Orders and the lone segment of the manufacturing economy that is still flourishing
- Investor sentiment and the spike of fear
Subscribers can look for this report in their inbox or by clicking on the following link and logging in: Market Outlook for August 6
Not signed up yet? Subscribe now to receive full access to all of the research and analysis that we publish.
Sentiment on Friday, as gauged by the put-call ratio, ended overly bearish at 1.17.
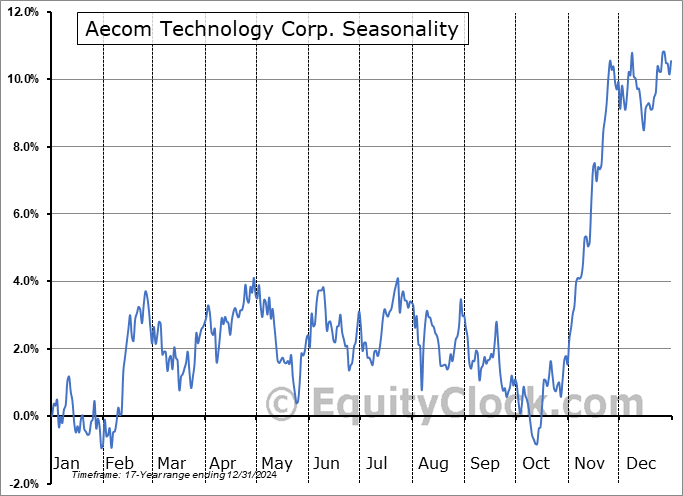
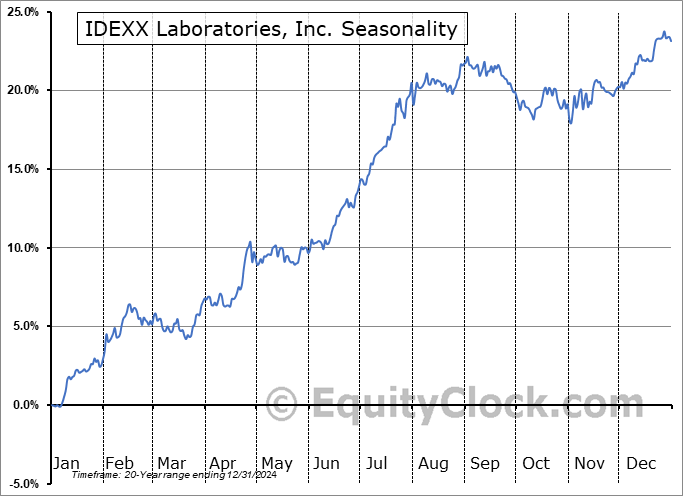
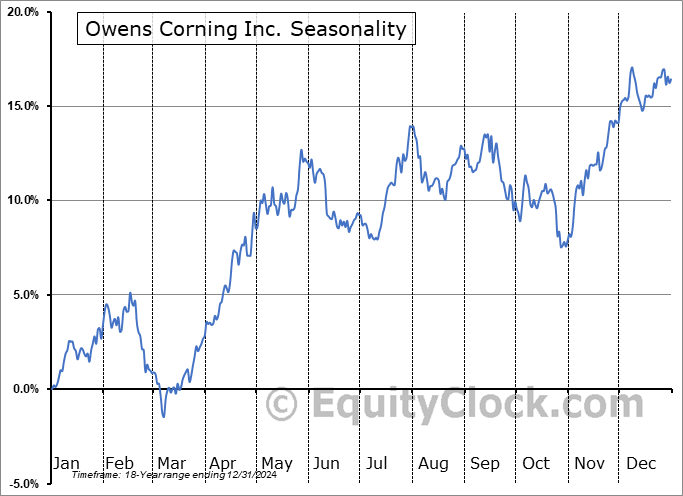
Seasonal charts of companies reporting earnings today:
S&P 500 Index
TSE Composite
| Sponsored By... |

|


