Stock Market Outlook for August 7, 2024

This is not just an unwind of the Yen carry trade, but also a collapse of short volatility positioning.
*** Stocks highlighted are for information purposes only and should not be considered as advice to purchase or to sell mentioned securities. As always, the use of technical and fundamental analysis is encouraged in order to fine tune entry and exit points to average seasonal trends.
Stocks Entering Period of Seasonal Strength Today:
Subscribers Click on the relevant link to view the full profile. Not a subscriber? Signup here.

Norfolk Southern Corp. (NYSE:NSC) Seasonal Chart

AMERISAFE, Inc. (NASD:AMSF) Seasonal Chart

Prospect Capital Corp. (NASD:PSEC) Seasonal Chart

Neurocrine Biosciences, Inc. (NASD:NBIX) Seasonal Chart
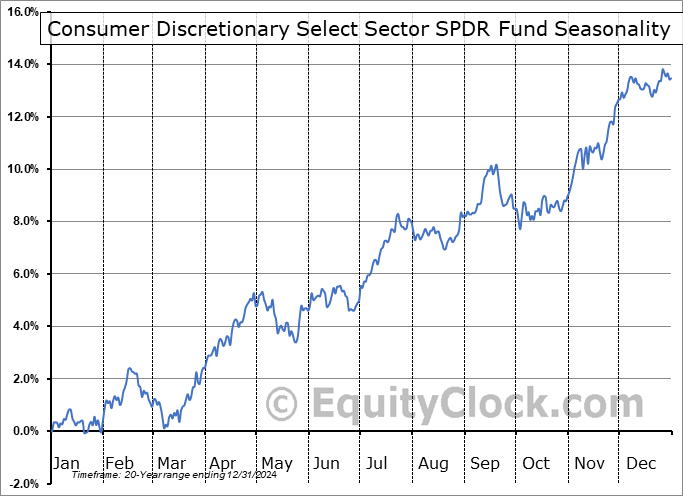
Consumer Discretionary Select Sector SPDR Fund (NYSE:XLY) Seasonal Chart
The Markets
Stocks snapped back on Tuesday, attempting to rebound from Monday’s global equity market selloff as short-term traders step in to take advantage of some of the extremes that have materialized following recent price action. The S&P 500 Index closed with a gain of 1.04%, moving into Monday’s downside gap and a zone of resistance between 5192 and 5321. Momentum indicators on the hourly chart of the large-cap benchmark have adopted characteristics of a bearish trend below their middle lines, emphasizing the short-term declining trajectory that is well ingrained. But it is the intermediate-term (multi-month) trend that is of greater interest to us in our seasonal approach and with the benchmark below its 100-day (5308) moving average for the first time since last October, there is certainly a burden on the broad market benchmark through the weeks and months ahead. Momentum indicators have similarly fallen to the lowest level since last fall, warranting a skeptical view of any near-term strength as the benchmark resets following the conclusion to the bullish trend that prevailed previous. As we have been emphasizing, defensive assets and volatility hedges are certainly preferred at this time of year (see our list of Accumulate candidates that are showing price action conducive to adding to portfolios), a call that has been prudent over the past many sessions. In our model portfolios, we have been positioned for this onset of volatility and have been embracing the appreciation in our defensive/risk-off holdings in recent weeks.

Today, in our Market Outlook to subscribers, we discuss the following:
- The collapse of short volatility
- The abnormal decline of the US Dollar amidst this period of seasonal volatility
- Gold
- Our weekly chart books update, along with our list of all segments of the market to either Accumulate or Avoid
- Investor sentiment
Subscribers can look for this report in their inbox or by clicking on the following link and logging in: Market Outlook for August 7
Not signed up yet? Subscribe now to receive full access to all of the research and analysis that we publish.
Want to know which areas of the market to buy or sell? Our Weekly Chart Books have just been updated, providing a clear Accumulate, Avoid, or Neutral rating for currencies, cryptocurrencies, commodities, broad markets, and subsectors/industries of the market. Subscribers can login and click on the relevant links to access.
- Currencies
- Cryptocurrencies
- Commodities
- Major Benchmarks
- Sub-sectors / Industries
- ETFs: Bonds | Commodities | Equity Markets | Industries | Sectors
Subscribe now.
Sentiment on Tuesday, as gauged by the put-call ratio, ended bearish at 1.12.

Seasonal charts of companies reporting earnings today:

 Seasonal Chart")


 Seasonal Chart")

S&P 500 Index


TSE Composite


| Sponsored By... |

|


