Stock Market Outlook for August 16, 2024

Consumer spending snapped back in July, but a more discerning consumer mentality remains.
*** Stocks highlighted are for information purposes only and should not be considered as advice to purchase or to sell mentioned securities. As always, the use of technical and fundamental analysis is encouraged in order to fine tune entry and exit points to average seasonal trends.
Stocks Entering Period of Seasonal Strength Today:
Subscribers Click on the relevant link to view the full profile. Not a subscriber? Signup here.

iShares MSCI Global Energy Producers ETF (AMEX:FILL) Seasonal Chart

iShares Core MSCI Pacific ETF (AMEX:IPAC) Seasonal Chart

Krystal Biotech, Inc. (NASD:KRYS) Seasonal Chart

Ross Stores, Inc. (NASD:ROST) Seasonal Chart

Orix Corp. (NYSE:IX) Seasonal Chart

LPL Financial Holdings Inc. (NASD:LPLA) Seasonal Chart

Balchem Corp. (NASD:BCPC) Seasonal Chart

Pure Storage, Inc. (NYSE:PSTG) Seasonal Chart

TotalEnergies SE (NYSE:TTE) Seasonal Chart

Global X Lithium ETF (NYSE:LIT) Seasonal Chart

BMO MSCI Emerging Markets Index ETF (TSE:ZEM.TO) Seasonal Chart

The Descartes Systems Group, Inc. (TSE:DSG.TO) Seasonal Chart

MakeMyTrip Ltd. (NASD:MMYT) Seasonal Chart

Nexstar Media Group, Inc. (NASD:NXST) Seasonal Chart
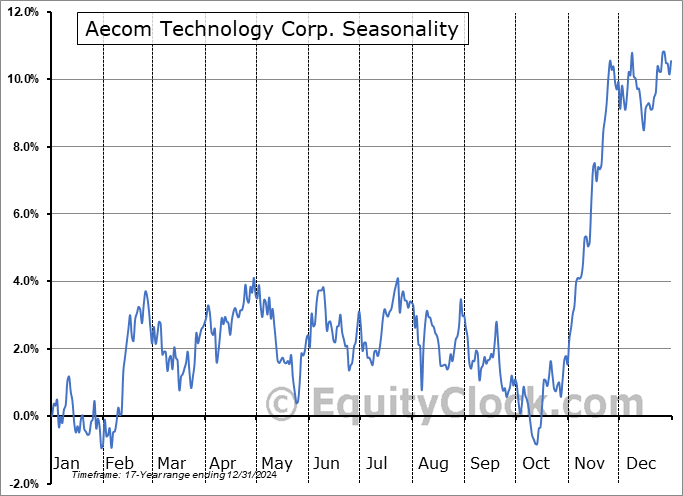
Aecom Technology Corp. (NYSE:ACM) Seasonal Chart
The Markets
Stocks surged on Thursday, moving beyond their recent volatility shock, following the release of a much stronger than expected read of retail sales for the month of July. The S&P 500 Index closed higher by 1.61%, gaping above implied resistance at the 50-day moving average (5460) that threatened to cap the short-term rebound from the August 5th low. The rising intermediate-term trend of the equity market remains alive, for now, as the benchmark shows little effort breaking down levels of resistance overhead. Short-term resistance at the August high of 5566 is now the test, after which the all-time high at 5669 is the hurdle to watch. The degradation in economic fundamentals in recent months has risked resulting in higher than average volatility through this period of weakness for stocks in August, September, and October, and the desire is to continue to lean on the side of caution in risk assets so long as the macro economic backdrop expresses uncertainty. Longer-term momentum of stocks can be seen waning and the recent “shock in stocks” amidst the short-volatility collapse is likely to remain fresh on investor minds as we head into the heart of this erratic timeframe for the equity market over the next eight or nine weeks. No reason to stretch out on the risk spectrum with seasonal, fundamental, and technical uncertainties present.

Today, in our Market Outlook to subscribers, we discuss the following:
- Market internals suggest that a defensive bias remains in positioning
- US Retail Sales
- Retailer Inventories
- Visa Spending Momentum Index
- Weekly Jobless Claims and the health of the labor market
Subscribers can look for this report in their inbox or by clicking on the following link and logging in: Market Outlook for August 16
Not signed up yet? Subscribe now to receive full access to all of the research and analysis that we publish.
Sentiment on Thursday, as gauged by the put-call ratio, ended around neutral at 0.97.

Seasonal charts of companies reporting earnings today:


S&P 500 Index


TSE Composite


| Sponsored By... |

|


