Stock Market Outlook for August 21, 2024

Watch the VIX here as it starts to peg support at its 200-day moving average.
*** Stocks highlighted are for information purposes only and should not be considered as advice to purchase or to sell mentioned securities. As always, the use of technical and fundamental analysis is encouraged in order to fine tune entry and exit points to average seasonal trends.
Stocks Entering Period of Seasonal Strength Today:
Subscribers Click on the relevant link to view the full profile. Not a subscriber? Signup here.

Wyndham Hotels & Resorts, Inc. (NYSE:WH) Seasonal Chart

VersaBank (TSE:VBNK.TO) Seasonal Chart

First Asset Energy Giants Covered Call ETF (TSE:NXF/B.TO) Seasonal Chart

iShares Core S&P U.S. Total Market Index ETF (CAD-Hedged) (TSE:XUH.TO) Seasonal Chart

Laramide Resources (TSE:LAM.TO) Seasonal Chart
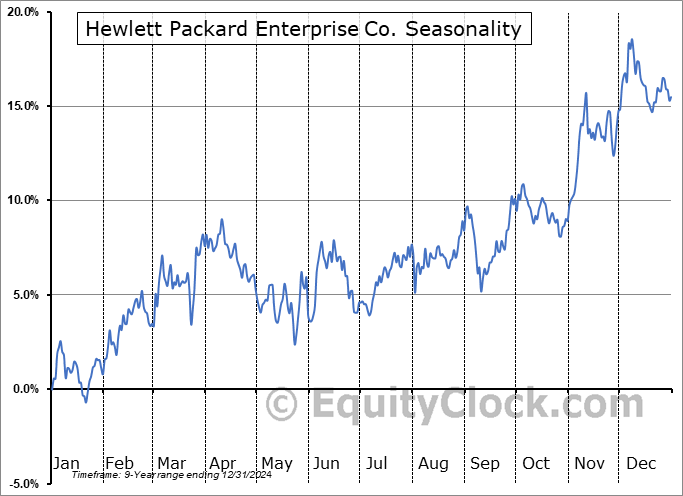
Hewlett Packard Enterprise Co. (NYSE:HPE) Seasonal Chart

Invesco S&P SmallCap 600 Revenue ETF (AMEX:RWJ) Seasonal Chart

iShares Russell 2000 Value ETF (NYSE:IWN) Seasonal Chart

WisdomTree Japan Hedged Equity Fund (NYSE:DXJ) Seasonal Chart

Taiwan Semiconductor Mfg (NYSE:TSM) Seasonal Chart

Six Flags Entertainment Corp. (NYSE:SIX) Seasonal Chart

Progress Software Corp. (NASD:PRGS) Seasonal Chart
The Markets
Stocks closed mildly lower on Tuesday as some of the buying momentum from recent days starts to stall as investors await comments from Jackson Hole later this week. The S&P 500 Index closed lower by two-tenths of one percent, sitting above recent short-term resistance at 5566. Upside gap support from Thursday’s breakout above the 50-day moving average remains unfilled between 5463 and 5501, presenting a zone to shoot short-term bullish bets against as we navigate into this period of short-term strength surrounding the last long weekend of summer. What remains important for the intermediate-term trend from this point is how both the level of the benchmark and momentum indicators fare compared to the previous highs set in July. Obviously, the inability of price to exceed the July peak would raise the prospect of a double-top pattern, while the rollover of momentum indicators below the levels charted through the spring and into the summer would attest to the same stalling of buying demand. The possibility of seeing an intermediate-term topping pattern develop around present levels is present, particularly as we get into the heart of the period of volatility for equity markets later in September. This market is providing opportunities for both the bulls and the bears (see our list of market segments to Accumulate or Avoid), but the backdrop is not present to be indiscriminately bullish of equity markets, as may have been the case earlier this year. The degradation in economic fundamentals in recent months continues to pose the threat of higher than average volatility through this timeframe and the desire is to continue to lean on the side of caution in risk assets so long as the macro economic backdrop expresses uncertainty.

Today, in our Market Outlook to subscribers, we discuss the following:
- Keeping our eye on the VIX
- US Housing Starts
- Canada Consumer Price Index (CPI)
- The Canadian Dollar
Subscribers can look for this report in their inbox or by clicking on the following link and logging in: Market Outlook for August 21
Not signed up yet? Subscribe now to receive full access to all of the research and analysis that we publish.
Sentiment on Tuesday, as gauged by the put-call ratio, ended bullish at 0.82.

Seasonal charts of companies reporting earnings today:
 Seasonal Chart")


S&P 500 Index


TSE Composite


| Sponsored By... |

|


