Stock Market Outlook for August 26, 2024

The abnormal rise in New Home Sales for July hints that the housing market has entered a new phase, one where looser conditions entices activity.
*** Stocks highlighted are for information purposes only and should not be considered as advice to purchase or to sell mentioned securities. As always, the use of technical and fundamental analysis is encouraged in order to fine tune entry and exit points to average seasonal trends.
Stocks Entering Period of Seasonal Strength Today:
Subscribers Click on the relevant link to view the full profile. Not a subscriber? Signup here.
Costco Wholesale Corp. (NASD:COST) Seasonal Chart
Prosperity Bancshares, Inc. (NYSE:PB) Seasonal Chart
Daktronics, Inc. (NASD:DAKT) Seasonal Chart
Dr. Reddy’s Laboratories Ltd (NYSE:RDY) Seasonal Chart
Asure Software (NASD:ASUR) Seasonal Chart
Gorman-Rupp Co. (NYSE:GRC) Seasonal Chart
GraniteShares Platinum Shares ETF (AMEX:PLTM) Seasonal Chart
WisdomTree U.S. ESG Fund (AMEX:RESP) Seasonal Chart
SPDR S&P Transportation ETF (NYSE:XTN) Seasonal Chart
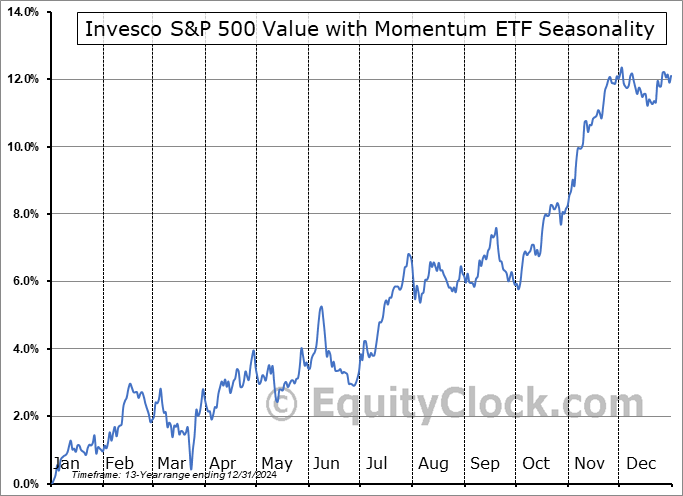
Invesco S&P 500 Value with Momentum ETF (AMEX:SPVM) Seasonal Chart
iShares Russell Top 200 Value ETF (NYSE:IWX) Seasonal Chart
Nike Inc. (NYSE:NKE) Seasonal Chart
China Automotive Systems Inc. (NASD:CAAS) Seasonal Chart
Wipro Ltd. (NYSE:WIT) Seasonal Chart
The Markets
Stocks got a boost on Friday following a speech from Fed Chair Jerome Powell, who indicated that “the time has come for policy to adjust.” The S&P 500 Index recorded a gain of 1.15%, erasing all of the prior session’s decline that produced an outside reversal candlestick and raised concerns of upside exhaustion to the rebound rally off of the August lows. The benchmark is back testing a zone of implied resistance between 5622 and 5658, which is the July 17th gap down that laid the breadcrumbs towards the volatility spike that was realized a few weeks ago. Hint of a short-term peak developing remains apparent, something that, if confirmed, would raise the risk of an intermediate-term double-top pattern below the all-time high recorded during the summer rally period through the first half of July. Short-term momentum indicators have rolled over and the MACD histogram on the daily chart is no longer on the rise, threatening to result in a bearish divergence with respect to this momentum indicator ahead as the bullish intermediate-term (multi-month) trend loses its grip. Caution in risk assets remains appropriate, particularly while within this period of seasonal volatility and while the fundamental backdrop appears uncertain.
Today, in our Market Outlook to subscribers, we discuss the following:
- Weekly look at the large-cap benchmark
- US New Home Sales
- Consumer Loan Activity and the bias towards home equity loans
- Delinquency Rate on consumer debt
- Canada Retail Sales
Subscribers can look for this report in their inbox or by clicking on the following link and logging in: Market Outlook for August 26
Not signed up yet? Subscribe now to receive full access to all of the research and analysis that we publish.
Sentiment on Friday, as gauged by the put-call ratio, ended bearish at 1.08.
Seasonal charts of companies reporting earnings today:
S&P 500 Index
TSE Composite
| Sponsored By... |

|


