Stock Market Outlook for September 6, 2024

The decline in the price of Oil below significant support at $70 risks a flaring of credit spreads as fundamental conditions deteriorate.
*** Stocks highlighted are for information purposes only and should not be considered as advice to purchase or to sell mentioned securities. As always, the use of technical and fundamental analysis is encouraged in order to fine tune entry and exit points to average seasonal trends.
Stocks Entering Period of Seasonal Strength Today:
Subscribers Click on the relevant link to view the full profile. Not a subscriber? Signup here.

SIFCO Industries, Inc. (AMEX:SIF) Seasonal Chart

Esquire Financial Holdings, Inc. (NASD:ESQ) Seasonal Chart

SPDR MSCI EAFE Fossil Fuel Reserves Free ETF (AMEX:EFAX) Seasonal Chart

Invesco DWA Financial Momentum ETF (NASD:PFI) Seasonal Chart

BMO US Dividend ETF (TSE:ZDY.TO) Seasonal Chart

iShares Global Agriculture Index ETF (TSE:COW.TO) Seasonal Chart

VSE Corp. (NASD:VSEC) Seasonal Chart

Ingersoll Rand Inc (NYSE:IR) Seasonal Chart

ESSA Bancorp Inc (NASD:ESSA) Seasonal Chart

eHealth Inc. (NASD:EHTH) Seasonal Chart
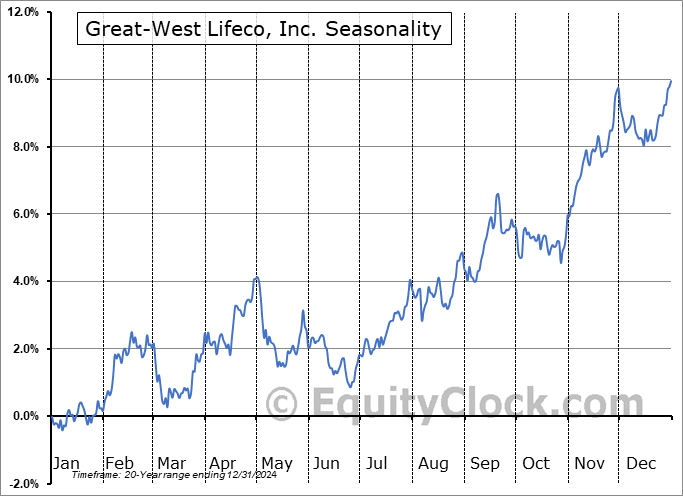
Great-West Lifeco, Inc. (TSE:GWO.TO) Seasonal Chart
The Markets
Stocks continued to struggle to get off the floor for a third day as investors react to the topping pattern developing on major benchmarks and brace for the release of the Non-Farm Payroll report on Friday. The S&P 500 Index closed with a loss of three-tenths of one percent, continuing to roll over from implied resistance between 5622 and 5658, representing the July 17th downside gap. A short-term peak has become confirmed as the bulls show their reluctance adding to risk at current heights and scrutiny of the risk that an intermediate-term double-top pattern has developed remains prudent. The chart setup continues to set the stage for the declines that are normal for stocks during the month of September, assuming that support at 20 and 50-week moving averages around 5500 fails to hold. MACD has crossed back below its signal line, confirming the negative divergence versus price that has highlighted the waning of buying demand heading into the traditionally weak month for equity market performance in September. Caution in risk assets remains appropriate, particularly while within this period of seasonal volatility and while the fundamental backdrop appears uncertain.

Today, in our Market Outlook to subscribers, we discuss the following:
- Weekly Jobless Claims and the health of the labor market
- A look ahead at what to expect for August’s Nonfarm Payroll report
- US Vehicles Sales
- The seasonal trade in Natural Gas
- The breakdown of Oil (WTI Crude) below the $70 threshold
- Credit spreads starting to tick higher
Subscribers can look for this report in their inbox or by clicking on the following link and logging in: Market Outlook for September 6
Not signed up yet? Subscribe now to receive full access to all of the research and analysis that we publish.
Sentiment on Thursday, as gauged by the put-call ratio, ended bullish at 0.85.

Seasonal charts of companies reporting earnings today:


S&P 500 Index


TSE Composite


| Sponsored By... |

|


