Stock Market Outlook for September 11, 2024

Investors have become less enthusiastic about stocks, causing a pullback/alleviation of the the extreme bullishness that had built up earlier this year.
*** Stocks highlighted are for information purposes only and should not be considered as advice to purchase or to sell mentioned securities. As always, the use of technical and fundamental analysis is encouraged in order to fine tune entry and exit points to average seasonal trends.
Stocks Entering Period of Seasonal Strength Today:
Subscribers Click on the relevant link to view the full profile. Not a subscriber? Signup here.

Commerce Bancshares, Inc. (NASD:CBSH) Seasonal Chart
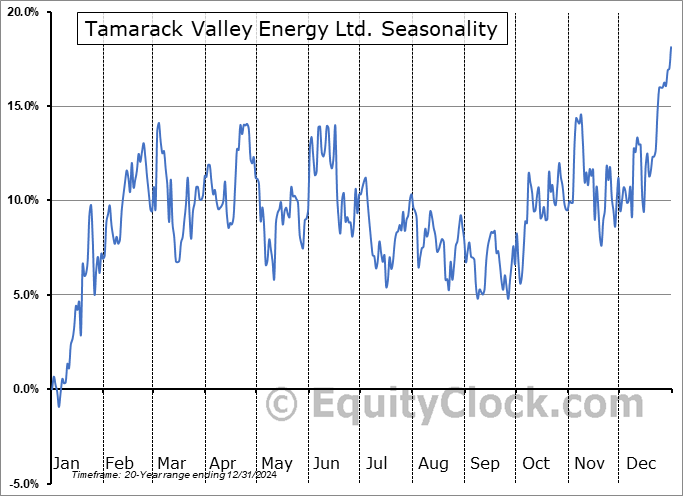
Tamarack Valley Energy Ltd. (TSE:TVE.TO) Seasonal Chart

Bank of Hawaii Corp. (NYSE:BOH) Seasonal Chart

Ameris Bancorp (NASD:ABCB) Seasonal Chart

City Holding Co. (NASD:CHCO) Seasonal Chart

Templeton Emerging Markets Fund, Inc. (NYSE:EMF) Seasonal Chart

Azenta, Inc. (NASD:AZTA) Seasonal Chart

Wall Financial Corp. (TSE:WFC.TO) Seasonal Chart
The Markets
Stocks closely slightly higher on Tuesday as the technology sector continues to rebound from recent weakness. The S&P 500 Index ended with a gain of just over four-tenths of one percent, reaching up to implied levels of resistance at the 20 and 50-day moving averages (5550 and 5505). Resistance remains implied between 5622 and 5658, representing the July 17th downside gap. An intermediate-term double-top pattern has become confirmed, a chart setup that continues to set the stage for ongoing declines that are normal for stocks during the month of September and has enticed us to add the large-cap benchmark to our list of Avoid candidates. MACD remains on a sell signal after crossing below its signal line, confirming the negative divergence versus price that has highlighted the waning of buying demand heading into the traditionally weak month for equity market performance in September. Caution in risk assets remains appropriate, particularly while within this period of seasonal volatility and while the fundamental backdrop appears uncertain.

Today, in our Market Outlook to subscribers, we discuss the following:
- Shifting investor perceptions towards stocks
- NYSE Advance-Decline line
- US Wholesale Sales
- The ongoing decline of wholesale inventories
Subscribers can look for this report in their inbox or by clicking on the following link and logging in: Market Outlook for September 11
Not signed up yet? Subscribe now to receive full access to all of the research and analysis that we publish.
Sentiment on Tuesday, as gauged by the put-call ratio, ended bullish at 0.86.

Seasonal charts of companies reporting earnings today:


S&P 500 Index


TSE Composite


| Sponsored By... |

|


