Stock Market Outlook for September 16, 2024

The weakest period of the year for stocks is directly ahead, but three influences could work to mitigate this seasonal threat.
*** Stocks highlighted are for information purposes only and should not be considered as advice to purchase or to sell mentioned securities. As always, the use of technical and fundamental analysis is encouraged in order to fine tune entry and exit points to average seasonal trends.
Stocks Entering Period of Seasonal Strength Today:
Subscribers Click on the relevant link to view the full profile. Not a subscriber? Signup here.

Kootenay Silver, Inc. (TSXV:KTN.V) Seasonal Chart

Tompkins Financial Corp. (AMEX:TMP) Seasonal Chart
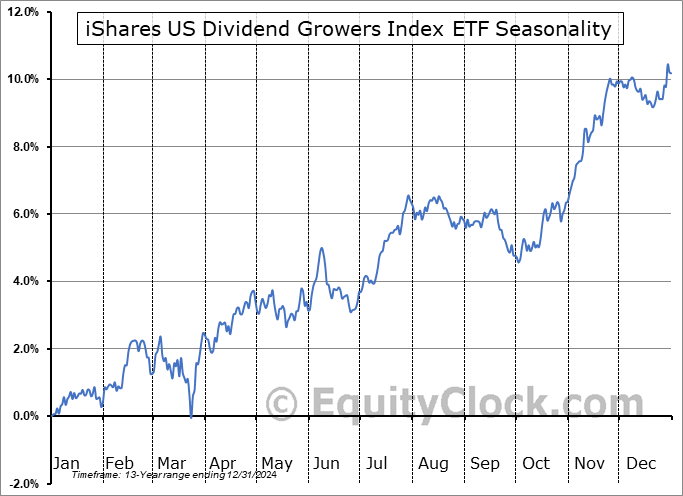
iShares US Dividend Growers Index ETF (CAD-Hedged) (TSE:CUD.TO) Seasonal Chart

Red Violet, Inc. (NASD:RDVT) Seasonal Chart

Oil Dri Corp. Of America (NYSE:ODC) Seasonal Chart

SPDR S&P Dividend ETF (NYSE:SDY) Seasonal Chart

BlackRock Health Sciences Trust (NYSE:BME) Seasonal Chart

York Water Co. (NASD:YORW) Seasonal Chart

Illinois Tool Works, Inc. (NYSE:ITW) Seasonal Chart

Safety Insurance Group, Inc. (NASD:SAFT) Seasonal Chart
The Markets
Stocks continue to recover from the prior week’s decline as the bulls pull major benchmarks back from the edge of the cliff that they were bordering on just one week ago. The S&P 500 Index ended higher by just over half of one percent, continuing to move above implied resistance at the 20 and 50-day moving averages. The recovery continues to skew the look of the intermediate-term topping pattern that was charted from last week’s rollover below the mid-July (summer rally) peak. The large-cap benchmark has broken slightly above the range of last week’s bearish candlestick, offsetting the threat that the topping pattern was showing just a short time ago. However, with the weakest part of September is still ahead, running through the last couple of weeks of the month, it is difficult to signal the all-clear to entertain a more risk-on perspective to portfolio allocations in the very near-term (next couple of weeks). We will err on the side of caution that the seasonal tendencies portray for the remaining days of September, but acknowledge that the technical framework is no longer lending itself to a bearish outcome as a base-case scenario.Investments denoted as Accumulate candidates in our chart books continue to work very well, while those indicated as ones to Avoid will obviously warrant scrutiny through the weeks ahead as we progress through this period of seasonal volatility for stocks and as the best six months of the year timeframe nears. The hurdles to watch for a directional bias for the intermediate-term trend are support at the 100-day/20-week moving average (5405) and downside gap resistance between 5622 and 5658; a break of either would likely continue the near-term direction of travel, either higher or lower. Until then, a narrowing consolidation span is the dominant pattern.

Today, in our Market Outlook to subscribers, we discuss the following:
- Weekly look at the large-cap benchmark
- Market internals still profiling paths of risk aversion
- The weakest time of the year for stocks
- The historical return impact on portfolios by staying invested over the next couple of weeks
- US Dollar Index
- Volatility Index (VIX)
- Liquidity being provided to the market from the Fed
Subscribers can look for this report in their inbox or by clicking on the following link and logging in: Market Outlook for September 16
Not signed up yet? Subscribe now to receive full access to all of the research and analysis that we publish.
Sentiment on Friday, as gauged by the put-call ratio, ended close to neutral at 0.93.

Seasonal charts of companies reporting earnings today:


S&P 500 Index


TSE Composite


| Sponsored By... |

|


