Stock Market Outlook for September 26, 2024

The value of the largest asset for most Americans speaks directly to the wealth effect and it has just stalled.
*** Stocks highlighted are for information purposes only and should not be considered as advice to purchase or to sell mentioned securities. As always, the use of technical and fundamental analysis is encouraged in order to fine tune entry and exit points to average seasonal trends.
Stocks Entering Period of Seasonal Strength Today:
Subscribers Click on the relevant link to view the full profile. Not a subscriber? Signup here.

Neuronetics, Inc. (NASD:STIM) Seasonal Chart

Schnitzer Steel Industries, Inc. (NASD:RDUS) Seasonal Chart

SNC-Lavalin Group, Inc. (TSE:ATRL.TO) Seasonal Chart

Stelco Inc. (TSE:STLC.TO) Seasonal Chart

Regal Rexnord Corporation (NYSE:RRX) Seasonal Chart

Jabil, Inc. (NYSE:JBL) Seasonal Chart

SPDR S&P China ETF (NYSE:GXC) Seasonal Chart

Voya Financial, Inc. (NYSE:VOYA) Seasonal Chart

PC Connection, Inc. (NASD:CNXN) Seasonal Chart
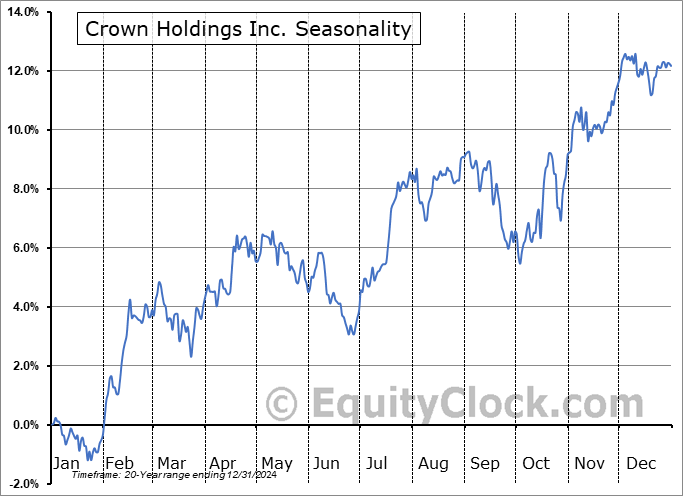
Crown Holdings Inc. (NYSE:CCK) Seasonal Chart

Ternium SA (NYSE:TX) Seasonal Chart

Stifel Financial Corp. (NYSE:SF) Seasonal Chart

BHP Group Limited (NYSE:BHP) Seasonal Chart
The Markets
Stocks ended slightly lower on Wednesday as traders start to digest the strength that has been realized in the market over the past couple of weeks. The S&P 500 Index ended with a decline of just less than two-tenths of one percent, charting a rather indecisive doji candlestick amidst a waning of near-term upside momentum. The benchmark remains above horizontal resistance that was broken last Thursday at 5650 and support remains well defined at the 100-day moving average (5455). Seasonality has us locked into a cautious view of stocks through the remaining days of September and the near-term evidence of upside exhaustion hints that we could get another test lower before the month is complete. The groups denoted as Accumulate candidates in our weekly chart books continue to work very well and we will scrutinize our list of Avoid candidates carefully once we get beyond this normally weak period on the calendar that corresponds with end of quarter mean reversion.

Today, in our Market Outlook to subscribers, we discuss the following:
- Short volatility trade still showing weak technicals
- US New Home Sales and the stocks of the home builders
- Lumber and Forestry Stocks
- The stall in the rise of US home prices
Subscribers can look for this report in their inbox or by clicking on the following link and logging in: Market Outlook for September 26
Not signed up yet? Subscribe now to receive full access to all of the research and analysis that we publish.
Sentiment on Wednesday, as gauged by the put-call ratio, ended bullish at 0.76.

Seasonal charts of companies reporting earnings today:


S&P 500 Index


TSE Composite


| Sponsored By... |

|


